No audio available for this content.
This column discusses the results of the National Geodetic Survey (NGS) beta hybrid Geoid18 model and the differences between the beta model and the official hybrid geoid model, Geoid12B. It provides examples to explain the symbology of the Beta Geoid18 Web Map. GEOID18 will be the last hybrid geoid model that NGS will create before NAVD 88 is replaced by the North American-Pacific Geopotential Datum of 2022 (NAPGD2022). I encourage users to access, investigate and become familiar with the web map.
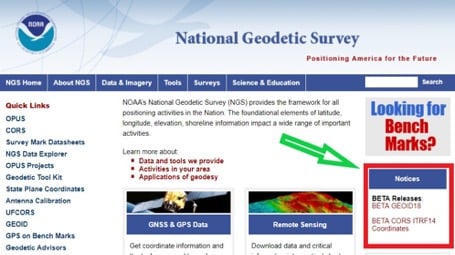
My last column included links to the NGS website that provides the beta coordinates and information about the latest Multi-Year CORS solution (MYCS 2). The column also noted that in late February 2019, NGS released a beta version of the latest hybrid geoid model. See Figure 1, “National Geodetic Survey’s Home Web Page.” This column discusses the Beta Geoid18 Web Map, the results of the hybrid Geoid18 model, and the differences between the beta model and the official hybrid model, Geoid12B.
The Geoid18 hybrid geoid model can be accessed here. See Figure 2, Excerpt from Beta Geoid18 Website. The site provides an opportunity for users to compute a Beta Geoid18 value for a particular station. I would encourage all users to obtain an understanding of the new hybrid model. Once again, it should be noted that this model is a beta model for users to test their workflows and should never be used for official or production work. This allows users to identifies potential issues and differences between Geoid12B and Geoid18, and then contact NGS if they have a question. NGS has done a tremendous job of explaining the Geoid18 process and results, and would appreciate users helping to evaluate the new hybrid model. Several of my previous columns have highlighted the NGS GPS on Bench Marks (GPS on BMs) program and how users have supported the development of the hybrid Geoid18 model: Part 5, Part 6, Part 7, Part 8 and Part 9.
The NGS Beta Geoid18 website provides access to GIS tools that allow users to identify changes between Geoid12B and Geoid18 in their area of interest. The site also states that the hybrid geoid model, Geoid18, will be the last hybrid geoid model that will be created before the new geopotential datum, NAPGD2022, is adopted as the official datum. This is the opportunity for users to be involved in the analysis of the Beta hybrid geoid model. NGS will consider changes to the Beta model until it becomes an official published product. This hybrid geoid model is slightly different from the previous hybrid geoid model, Geoid12B. Similar to Geoid12B, the majority of the design of the hybrid model comes from the relationship between the NGS’ GNSS-derived ellipsoid-derived heights and the leveling- derived orthometric NAVD 88 heights. In other words, the hybrid model is designed to fit to the NAVD 88 orthometric heights.
That said, since the creation of hybrid Geoid12b, there have been improvements in the underlying gravimetric geoid model used in Geoid18. These improvements include:
- Better elevation data and improved digital elevation modelling techniques,
- New gravity data from satellite gravity missions,
- New airborne gravity data from the NGS GRAV-D program, and
- Improved geoid modeling techniques.
My previous columns have focused on procedures and routines for establishing GNSS-derived orthometric heights. As I’ve mentioned in these columns, there are many ways to analyze and investigate GNSS data and adjustment results. I have provided basic concepts that I believe are important for users to understand. My October 2016 column focused on the NGS “GPS on BMS (GPSBM)” dataset that was used to create the last hybrid geoid model, Geoid12B.
As mentioned in my October 2015 column, the hybrid geoid model is designed to fit the published NAVD 88 leveling-derived orthometric heights. I highlighted that the GPS on BMs dataset can be used to identify potential issues in the NAVD 88 published orthometric heights. The October 2016 column provided tools and routines that can be used to identify potential issues in NAVD 88 heights and/or NAD83 (2011) published ellipsoid heights. In support of the Beta Geoid18, NGS performed a detailed analysis of the GPS on BMs stations that were used in the creation of Geoid18.
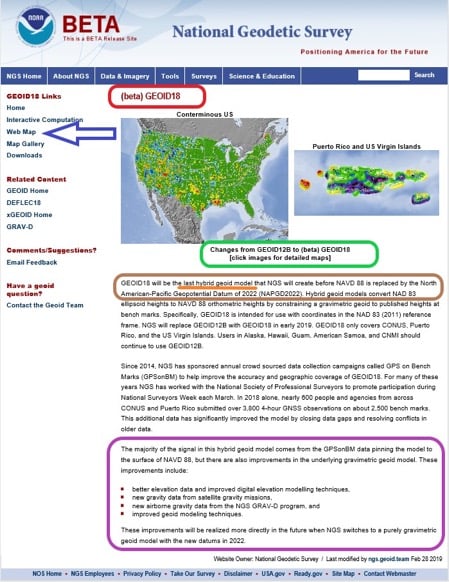
If you click on the “Web Map button” on the Geoid18 web page (see arrow in Figure 2), you may see the statement highlighted in Figure 3. Clicking on the link will redirect you to the correct web site (see Figure 4.).

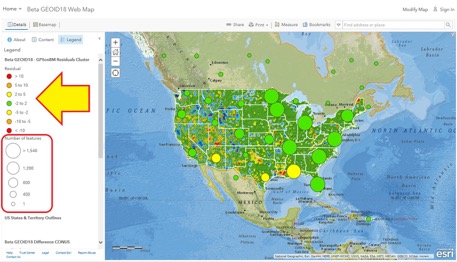
- This data layer provides the value of the post-modeled residuals for all of the GPS on Bench Marks that were part of the evaluation of the Beta GEOID18 model. This Feature Layer is used to populate several layers in the Beta GEOID18 Web Map including the layers called Residuals and GPSonBM. The data for this web map can be found here.
- This data layer denotes whether the GPS on Bench Mark was used or rejected in the development of the Beta hybrid geoid GEOID18. The data for this web map can be found here.
- This data layer denotes whether the GPS on Bench Mark was used or rejected in the development of the hybrid geoid GEOID12B. This has all of the same attributes as the spreadsheet provided on the NGS GEOID12B web page. More information can be found here.
- This is a tile package that displays the difference between GEOID18 and GEOID12B in CONUS. It contains two overlayed raster files, one of which is the estimated error and the other is its hill shade. The data for this web map can be found here.
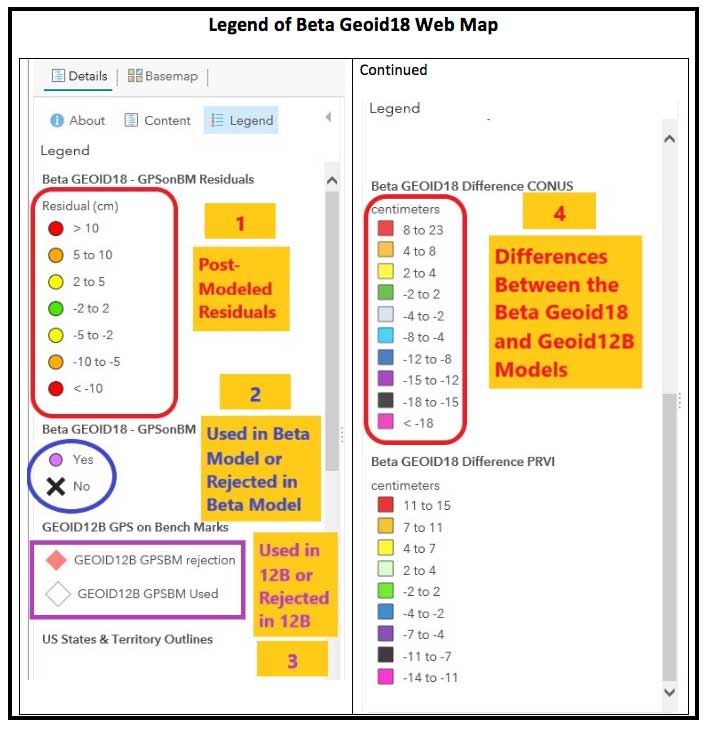
Clicking on the “Content” link provides the data layers (see Figure 6). The user can turn these layers on and off depending on what they’re interested in analyzing.

As previously stated, additional details are available as the user zooms into an area of interest (see Figure 7). Five stations have been highlighted in this figure to explain the symbology used on the Web Map site. See Figure 8 for these explanations.

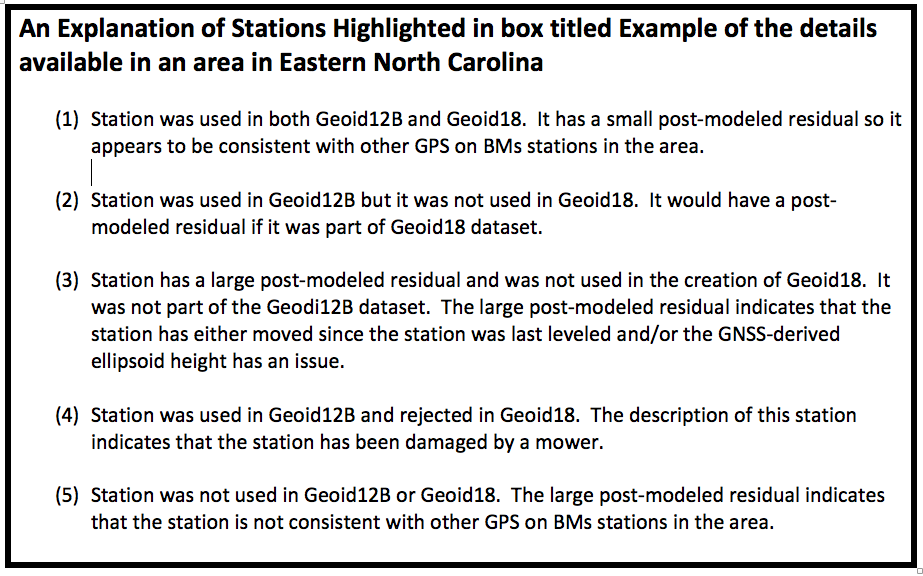
Figure 8. An Explanation of Stations Highlighted in box titled Example of the details available in an area in Eastern North Carolina (Screenshot: National Geodetic Survey)
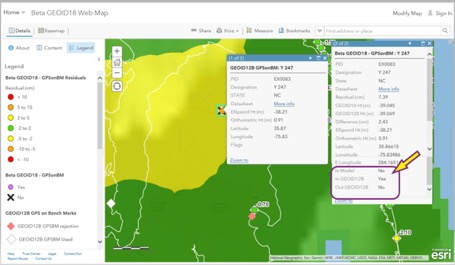
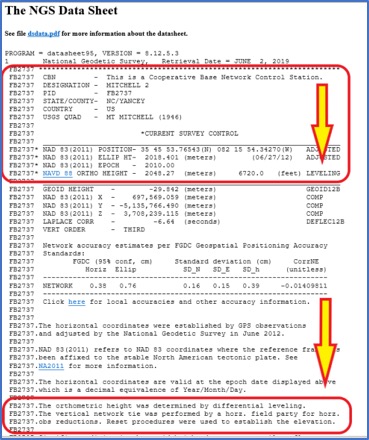
When the user clicks on a station’s icon, another window appears that provides specific information about that station. See Figure 9. If the user clicks on the “More Info” button, the routine retrieves the NGS datasheet from the NGSIDB (see Figure 10). As the NGS datasheet states at the end of the description for station Y 247, the station has been obliterated by a mower, which is why it probably was not used in Geoid18.
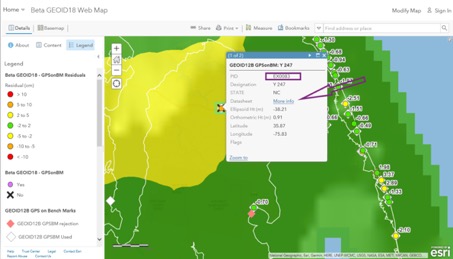

Figure 11 provides all the information available for station Y 247. It should be noted that the station was used in Geoid12B and not used in Geoid18. This means that there will be differences between Geoid12B and Geoid18 in areas where a station was used in Geoid12B but not used in Geoid18. The amount of the difference will depend on the size of the post-modeled residual. In this example, the post-model residual is 7.39 cm.
GPS on BMs data are usually based on different epochs of data; that is, the leveling data is usually observed at a different epoch than the GNSS data. This means, if the station has moved since the last time it was leveled, then the GNSS-derived ellipsoid height minus the leveling-derived orthometric height will not be equal to the geoid height. The procedure for computing GPS on BMs residuals was described in my February 2018 column. To determine if a bench mark had moved since it was last leveled, the analyst needs several nearby bench marks occupied by GNSS.Users have been very important to the development of Geoid18 by participating in NGS’ GPS on BMs program. These data have been used to improve the reliability of the hybrid geoid model. Users can now help by evaluating areas that have large changes between Geoid12B and Geoid18 (see box titled Figure 12). To help ensure that the appropriate stations were used to create the hybrid geoid model Geoid18, users could occupy nearby stations in the area to evaluate the reliability of the model. This will help NGS improve the reliability of the model in that region.

I described the NGS’ published height codes in my October 2016 column. In the case of Mitchell 2, there’s no leveling data in NGS’ database in the area surrounding Mitchell 2. There may be leveling projects that have been performed by other agencies such as the USGS but the leveling data have not been processed and loaded into NGS’ database. Users could help by performing GNSS observations on bench marks in the region that are in NGS’ database and/or by performing leveling observations between the GPS on BMs station and the nearest bench mark that has leveling data in NGS’ database.In the example of a large difference between Geoid12B and Geoid18 in Western North Carolina, station Mitchell 2 (PID FB2737) was used in Geoid12B but not used in Geoid18. It wasn’t used in Geoid18 because the NAVD 88 height was not based on an adjustment. According to the description, the leveling tie was performed by a field party that was performing a horizontal survey project (see Figure 13). The field party performed the appropriate leveling procedures but, in this case, the leveling data have not been placed in computer-readable form, so the orthometric height cannot be verified.
I encourage users to access the web map and investigate stations that have large post-modeled residuals and/or stations that were used in Geoid12B but were not used in Geoid18. The NGS analyst rejected stations based on pre- and post-modeled residuals but many times there wasn’t enough redundant information available to ensure the station should be rejected or used in the creation of the hybrid geoid model. Users should be commended for their participation in the GPS on BMs program. Hopefully, users will continue their support by evaluating the beta hybrid geoid model.