Listen to this content
For centuries before sonar, lidar and unmanned surface vehicles (USVs), sailors would measure depths by throwing a line overboard with a lead weight at the end — called a leadline — and record its length to the seafloor. Mapping large areas of the seafloor, therefore, required thousands of these measurements.
However, even after extensive measurement efforts, the acquired data was often inaccurate or incomplete, which forced navigators and surveyors to estimate the seafloor’s bathymetry until remote sensing was introduced in the 1970s.
Since then, the growing need for increasingly accurate and rapidly available data has led to a worldwide effort to develop sensors and alternative techniques for measuring depths.
In the ongoing Florida Seafloor Mapping Initiative (FSMI), the Florida Department of Environmental Protection tasked Woolpert Geospatial Program with acquiring bathymetric survey data using lidar technologies to produce a comprehensive, publicly available, high-resolution seafloor surface model of Florida’s coastal waters by 2026.
Similar initiatives across the globe have kick-started innovations in underwater data collection and interpretation. In this feature, SBG Systems, CHC Navigation (CHCNAV) and Advanced Navigation describe how they used modern hydrographic surveying to aid defense departments, produce 3D topographic maps, and analyze the depth of The Great Blue Hole in Belize.
Exploring challenging waters
SBG Systems
Advancements in hydrographic surveys can lead to the exploration of depths previously unknown. The Great Blue Hole, located off the coast of Belize, is the largest marine sinkhole in the world, with a diameter of 300 m and a depth of 125 m. This major scuba hotspot is part of the Belize Barrier Reef Reserve System and a UNESCO World Heritage Site.

Aquatica Submarines conducted an expedition survey of the Blue Hole. For two weeks, a team of scientists, explorers, and filmmakers collected survey data and captured photos and videos of this geological wonder. It is the first time in history that an expedition of this scale was attempted at the Blue Hole.
The challenge: Finding submersibles to equip with sonar
The expedition team chose two submarines to carry out the survey: its Stingray 500 and the Roatan Institute of Deepsea Exploration’s IDABEL. Both vessels can carry up to three persons for a maximum of 12 hours.
Norwegian technology group Kongsberg’s dual-axis sonar technology was used to create a 3D representation of the sinkhole. The surface and submarine-mounted sonar equipment were also equipped with SBG Systems’ Ellipse miniature inertial navigation system (INS).
The Ellipse was used to mark the Blue Hole perimeter and scientists then processed the recorded data using MS1000 processing software.
Additional steps and results: Analyzing 3D sonar maps
A key outcome of the expedition is the creation of a complete 3D sonar map of the Blue Hole using point-cloud data collected by Kongsberg’s dual-axis sonar to create a 3D map of the site. The sonar was pole-mounted on the survey vessel with the GPS receiver and motion reference unit directly over the scanner’s head.
Sonar expert Mark Atherton from Kongsberg’s Canadian subsidiary, Kongsberg Mesotech, was a key member of the science-based sonar and data collection team. Atherton operated the sonars aboard the Research Vessel Brooks McCall, contributing to an invaluable high-resolution map of the entire sinkhole.
“By understanding the geological history and geometric structure at the Blue Hole, we can contribute new data to the global scientific community studying sinkholes and cenotes,” Atherton said.
The team was able to conduct more than 20 dives into the large sinkhole, taking videos and 3D images during each trip. They also completed a two-hour live broadcast featured on The Discovery Channel.
“What [the Great Blue Hole] tells us is that sea level rise is not [always] a gradual process,” said Erika Bergman, Aquatica’s chief pilot and oceanographer. “We carefully measured the terraces and layers built up in the hole and we can see that sea level rise can happen dramatically.”
Producing 3D hydrodynamic models
CHC Navigation
Flood control structures — such as dikes, dams, spurs, drainage channels, and floodways — are designed to protect coastal and riverine areas of cities and farms and, above all, the people who live there.
To prevent flooding in low-lying regions and support national ecological protection and development strategies in the Yellow River Basin in China, the Ministry of Water Resources launched the “Digital Twin Yellow River Construction Plan (2022-2025)” project. The Chinese Bureau of Hydrology and Water Resources was tasked with building a digital twin flood model based on part of the country’s Yellow River, targeting the 28-km section of the river basin.
The challenge: Building and designing a digital twin flood model
The first step was to acquire 3D data underwater, on land, and from the air. CHC Navigation (CHCNAV) provided its Apache 6 and Apache 4 USVs to collect underwater data using multi-beam and single-beam echo sounders. The AlphaUni lidar system mounted on the BB4 UAV was used to gather the land data. Finally, the team obtained aerial data using an oblique photographic system from CHCNAV mounted on a UAV.
As a result, researchers obtained large-scale remote sensing images, laser point clouds, terrain data, oblique photography, CAD drawings, and BIM models.

CoPre software, a 3D laser scanning pre-processing software that can process captured raw data, including POS trajectories, lidar data, and RGB images, was used for the Tilt and DOM modeling.
CoProcess software, designed for reality capture post-processing tasks and DEM/DTM generation, generated high-precision DEM models, a 3D representation of a ground surface created from elevation data, with a point cloud density of more than 50 points/m2 for the areas above and below the water.
Additional steps
The remotely operated vehicles and generated models obtained site data such as climate records, flood maps, flow records, hydrologic summaries, groundwater level records, water quality, and resource data to use as the basis of the analysis.
The team also used historical flood information during the scoping phase to develop a conceptual model of the flood mechanisms. Based on the actual flood records, a third-party flood simulation platform was used to produce the entire flood process for the different years.
The real-time flood extrapolation was processed on the third-party software, which simulated steady and unsteady flow patterns using hydrodynamic modeling algorithms.
“Advancements in bathymetric surveying, incorporating cutting-edge technologies such as UAVs with lidar, USVs with echo sounders, and high-precision positioning systems, have transformed the creation of digital twin models for water bodies, particularly the Yellow River in China,” said Taxiya Wang, Business Development Manager of Marine Survey at CHC Navigation. “This bathymetric surveying effort has laid the foundation for hydraulic models, flood maps, and customized applications, emphasizing the importance of up-to-date, high-quality data in watershed engineering and construction projects.”
The result
Based on the developed digital flood model, the next step for the digital watershed twin project is to collaborate with technical staff, experts, and users to create customized applications for watershed engineering and construction. The project is ongoing and will end in 2025.
Surveying wet gaps
Advanced Navigation
Defense departments are continuously looking to improve the safety of military personnel and equipment in conflict regions. With this aim, the UK Defense Science and Technology Laboratory (DSTL) launched its “Map the Gap” competition. It invited engineering firms to design and build an unmanned surface vessel (USV) capable of quickly, reliably, and safely surveying wet gaps — including rivers, streams, canals, and waterways — without putting engineers and other personnel at risk. Commanders can then view the survey data to determine the safest crossing points for troops and equipment.
DSTL relied on Advanced Navigation’s Spatial FOG Dual fiber optic gyroscope to conduct the hydrographic surveying project.
The challenge: Building a USV to assist defense forces
Challenges in the project included measuring water depths and flow rates, crossing lengths, river-bed topography, and riverbank heights, as well as shape profiling and assessing ground load handling capabilities. The vehicles also had to be either remotely operated or fully autonomous and deliver the collected data in a way that could be easily interpreted for quick decision-making.
The survey required multiple sensor technologies for simultaneous above- and below-water 3D surveys. For above-water use, dual lidar sensors produce high-resolution point clouds of the surrounding environment. For below-water mapping, a sensor suite consisting of a multibeam sonar, an Acoustic Doppler Current Profiler/Doppler Velocity Log (ADCP/DVL), and a cone penetrometer were used to measure current and water flow as well as to test substrate density.
Ultrabeam Hydrographic won the DSTL competition. Its team integrated multiple sensors into a single housing and selected the four-wheeled Axolotl vehicle for the second phase of the project.
Additional steps
The team was in search of a GNSS/INS device capable of dead-reckoning and maintaining accurate heading for extended periods of time, which led them to Advanced Navigation’s Spatial FOG Dual GNSS/INS.
Ultrabeam Hydrographic had previously been using a MEMS-based solution that could maintain a suitably accurate heading without GNSS for up to approximately 60 seconds. However, tests with the Spatial FOG Dual showed that it could maintain an accurate heading for more than 15 minutes.
“The MEMS can hold onto heading for maybe 30 seconds to a minute, accurately. After that, it’s not reliable,” Gabriel Walton, Ultrabeam Hydrographic’s technical director said. “We have used the Spatial FOG Dual in certain circumstances where we went 10 to 15 minutes without GNSS. I do believe it will go on for longer.”
The team integrated the Advanced Navigation solution into their survey management and mission control software. This allowed the Spatial FOG Dual to be used for survey purposes and to provide motion data to the robot’s artificial intelligence (AI) for autonomous mission control and object detection and avoidance.
The result
“Map the Gap” Phase 2 demonstrated that the Axolotl’s mechanical design, sensor suite integration, extensive use of AI for autonomous mission control, decision-making and precise navigation can serve as a significant advancement for bathymetric surveying.
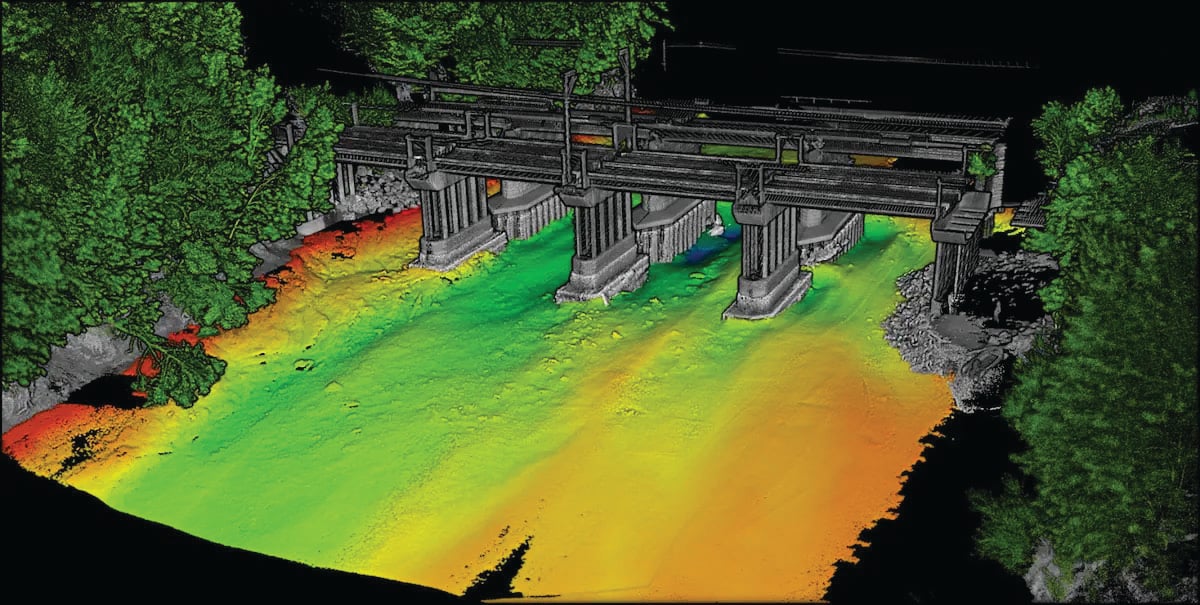
Since “Map the Gap,” Ultrabeam Hydrographic has deployed the Axolotl on commercial waterway survey missions, such as surveying bridge sites and attaining a clear understanding of riverbed and water conditions.