No audio available for this content.

Everywhere we look, data is being collected, reviewed, analyzed and stored. It used to be that data was a static piece of information, like a piece of paper in a filing cabinet. Millions of pieces of data being created yet almost all of it never to be used again. The computer and electronic storage began a revolution of how we warehouse this information but that was only the beginning. Technology has turned data into a living, breathing beast few understand yet it controls most of our lives in various ways.
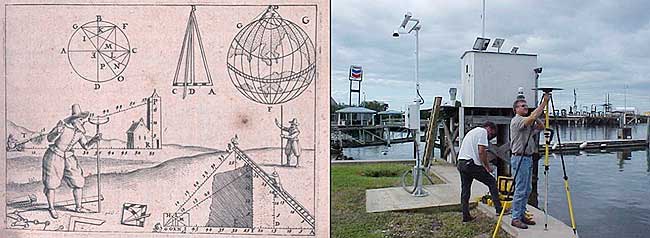
Mapping of the earth has not always been about establishing boundaries and parcels; many of the early maps and plats were created to depict the topography of our world. While there are some indications that Middle East maps depicted parcels, the first examples of topographic maps were created during the Roman Empire era of 300 A.D. It is common knowledge that the Romans utilized primitive yet cunning engineering for roads, buildings, and waterways but it was the initial topography that was mapped that allowed them to design those forward-thinking infrastructure components. Because of the lack of sophistication in the measuring methods and data collection, these topographic maps covered small areas and often crude because of the materials available. Considering what they were working with, it is still incredible what they were able to map, design and build.
Measuring devices and methods of data collection expanded over the centuries like most occupations and professions. By the 16th and 17th century, mathematics has been introduced at a wider scale through many educational facilities. Another profession, geographers, also advanced with the evolution of measuring devices and mapping techniques. It was during this period that we began to see a crossover with surveyors with geographers to create topographic maps with greater accuracy and precision through triangulation.
In the 18th and 19th century, instruments became more sophisticated to assist in the determination of elevations and more accurate angle measurements. The concept of triangulation flourished during this period and significant mapping was made for most of the civilized world. The early 1800s saw the westward push of expansion in the United States and Thomas Jefferson, U.S. president and former surveyor, led the charge to map the existing states and divide the west into sectional land for sale to settlers.
Besides the establishment of the Public Land Survey System, surveyors also provided topographic information for map of all sizes for future development planning. The late 1800s brought a large amount of topographic mapping information to paper through efforts by the U.S. Geological Society to map the entire United States. This information has been called the first land database; although crude in overall nature compared to today’s standards, it contained an enormous amount of topographic information.
These surveys continued well into the early 20th century until a revolutionary invention coupled with a current technology merged: the use of a mounted camera taking aerial photographs from an airplane. Geographers and photogrammetrists were able to use surveying data to assist with scaling orthometric photographs to create aerial images of thousands of acres of land. These aerial photos became the base layer for determining topographic features and contouring, covering much more land than ever before. Additional innovations included advancements in stereo plotting and photogrammetric techniques to further create high sophisticated topographic maps for the era. This type of mapping was the gold standard for decades depicting existing condition and topographic features for most of the world until the early 1970s and the computerized data revolution.
Computers take over the world (literally)

While mainframe computers became more universally used in the 1960s, their use was contained to governmental agencies and large corporations. As the physical size of the computer reduced, the computing capacity increased, programming became easier to complete, and more applications were created to perform a variety of tasks. One of the biggest advancements for the era was electronic storage and analyzation of data through programming. Relational databases became a hot ticket for large datasets; geographic data was the perfect fit for this type of application. Modern mapping was on its way forward at warp speed.
Topographic mapping was not lost in this shuffle. The survey itself is based upon data points located on the face of the earth so each point is just another chunk of information within the database. Programming continued to advance and soon methods previous completed by manual methods over long periods of time were completed in a fraction of previous efforts without fail.
This effort was also joined with advancements in graphical technology to display this data on a computer video screen instead of lines of green text and numbers. Vector-based graphics, together with enormous point databases, helped create large topographical and geographical maps for many uses. During the same time the US put a man on the moon, mapping and platting of topographic information was also out of this world.
The turn of the century brings big changes
For the next decade, there were small advances in technology for topographic surveys and data points, but most were in presentation of data and increases in computing power. Pen plotters and smaller yet more powerful computers were becoming affordable to smaller companies, but it was still a large investment to get into the computerized data game for a surveyor. By the mid-1980s, electronic data collection with a total station was becoming the norm, but only meant collecting more points in a more efficient timeframe. The computing component did get faster but is still producing the same information of static data points.
The mid-1980s also brought us a shiny new object: GPS technology. By the end of the 1990s, we were able to get out of our vehicle, start the receiver and collect geolocated points in minutes rather than hours. The big takeaway from this advancement is the geolocation component of the data point. Now everything can be related to one big dataset of topographical points. By creating a database with all our project data collected in the same georeferenced datums (horizontal & vertical), we can create digital models that replicate existing conditions.
We can also add another big advancement in data collection: remote sensing technology. From laser and lidar scanners, photogrammetry, SLAM technology and ground penetrating radar, the innovations to collect data at locations we can “see” through sensing are now a reality. Another significant improvement with this technology is the amount of data points remote sensing can collect, both in timing and spacing. We are now talking small scanning projects that consist of billions of points within the site point cloud. We are fortunate that our computing power and storage capabilities has increased exponentially along with the remote sensing. (Remember doing a “regen” on your CAD file and having time to get a cup of coffee?)
Lots of data — now what?
Data is powerful, especially when it is harnessed in a robust system that can analyze and model for future use. Yes, this condition also applies to the surveying world, even though you may not be thinking about it now. We can use this data to create a virtual world that mimics the one we live in; the difference is that we exist in ours yet model and manipulate the digital version in our computer system. The technology is now available, and we can make a replica of our current world; however, why would we want to do that? There are lots of reasons to use technology and data to make sophisticated topographic maps (because that is what they are) for recording the world around us.
One of the big differences now is that we have much more information about the data points we collect within our topographic maps. Sure, many surveyors will say that their data has not changed or evolved during their careers, but they would be wrong. Unless they are still manually writing it all down for hand plotting… (Hello! The 1960s called, and they want their field book back!) Every electronically collected point has attributes associated with the data.
These attributes, while they may be simple, contain important information about the datapoint it represents. Horizontal location? Check. Vertical elevation? Check. Assigned point number? Probably. Field code? Most likely. But it also has one other important component: time. We now know exactly when that point was collected. Why is that important?
Because, like a lot of instances, things change. Something collected today might not be there tomorrow. Time is just as important as the physical location and the type of point it represents.
Gather these points together, throw them in one big model and you have yourself a graphical database that can be analyzed, reviewed, and used for planning and design. It may be hard to visualize with just simple survey data using GNSS and/or a total station, but couple it with a scanner or photogrammetry, you have a powerful hunk of data for which to work.
Why is this workflow and modeling procedure important enough to dedicate an entire column about surveying and GNSS to? Because it used to be far in the future, but the need and availability to use it is now here in front of us. Surveying and GNSS are an important part of this effort to create three dimensional models. By using survey-grade data in conjunction with point clouds collected from remote sensing equipment, we can replicate the world around us in real time.
Yes, Virginia, there is a name for the modeling process…

The name for the proposed modeling of this dataset is a digital twin. It represents a digital representation of a physical object or system. NASA famously used the concept for their space program to simulate situations and procedures of many different types of events. The concept has grown with the technology to graphically create almost anything through digitalization and computer modeling. Once the model is created, both actual and proposed data points can be included to represent the existing and future opportunities.
The idea of a digital twin is not new; technology, however, has pumped more life into its existence by leaps and bounds with computing power and data storage capability. I remember, early in my career, going into an architect’s office and seeing the scale model mockup of a new development or building. The streets in the model were perfect, there were no drainage issues, and it was a neat as a pin. Fast forward to the construction of the development and field changes were at every turn. A digital twin will allow for better planning, more thorough design and creating more cost-effective development. Many large cities have started compiling data and building their digital twin, including New York, Singapore, Boston, and Rotterdam. Engineering and planning for new and replacement facilities is very expensive yet analysts predict that having a digital twin to work will save a significant amount of money and time.
As a surveyor, what’s in it for me?
Software capability for the surveyor is already here. Companies, such as Hexagon, Trimble, Topcon and Esri to name a few, have been developing their software to accommodate this concept for many years. Still, lots of surveyors do not know about it. And we should. Many of us live in places where the infrastructure is well past its useful life period and should have been replaced long ago. By starting now with survey-grade data to be put into a real-time model, we can help our governmental agencies and their consultants to move towards a digital twin that will ultimately save money and possibly lives.
What this means for the surveyor is to further embrace technology and include remote sensing into your operation. If you have not started at least looking into UAVs and photogrammetry, you are already behind. Many aerial operations are making the next leap into mounting a LiDAR unit on their UAV to gain even more capability. Early adopters of laser scanners were probably second guessing their decision during the 2008 Depression but if they stayed with it, it will be a big payoff in the long run. The next leap will be into handheld scanning devices, including ones using SLAM (simultaneous localization and mapping) technology for locating interior and close-up improvements. These technologies will cost a significant amount of time and money to implement but municipalities, engineers and architects are going to be clamoring for the data any day now.
When it comes to surveying and mapping of existing facilities, the surveyor and technology makes a great team. Do not let point clouds, remote sensing, or terabytes of data scare you away from providing badly needed information to help assemble your local digital twin. In the long run, it will pay off for all who take on the challenge of building it.