COVID-19 impact revealed through the lens of GPS

Movement, closeness, privacy — many things we took for granted a few months ago have become luxuries after the onset of COVID-19. To get an understanding of the scale and impact of the virus, we can look at global movement trends of people and merchandise using GNSS technology.
Marine
Before the coronavirus pandemic, globalization seemed to be increasing endlessly. Now, we face new trade restrictions, protectionist policies, and a global economic downturn that threatens to stunt growth for years to come.
In April, the World Trade Organization (WTO) forecast that global trade would fall by between 13% and 32% in 2020, surpassing the “great trade collapse” of 2009 spurred by the global financial crisis.
However, the situation isn’t completely bleak. According to a recent Tradeshift report, global trade decreased by 14.8% in the second quarter of 2020, putting us on the optimistic end of the WTO estimate. June saw a rise in trade activity, suggesting that we may be recovering from the initial effects of the pandemic.
Cargo vessels, tankers, tugs, and other kinds of commercial ships are equipped with satellite navigation devices that can receive information from GNSS satellites to compute precise location and time. Maritime tracking insights obtained via GNSS/GPS signals are a great method for measuring the impact of the coronavirus on trade.
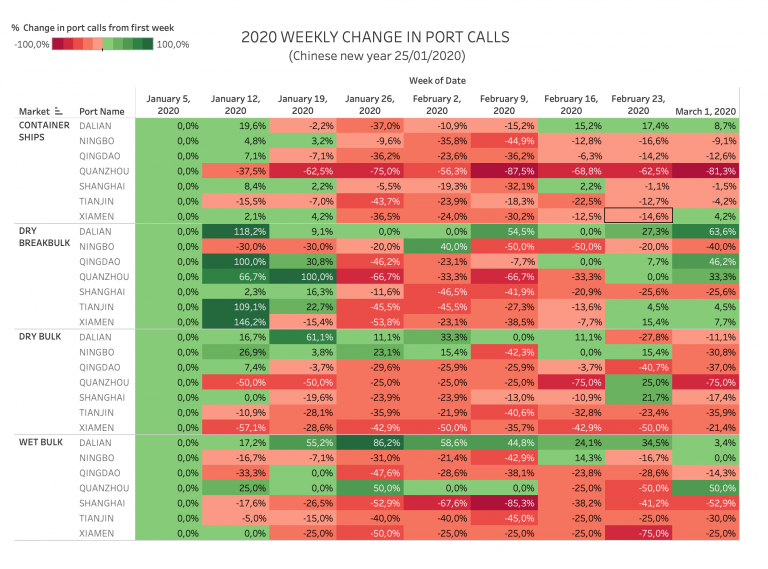
GPS data from MarineTraffic shows that ship arrivals decreased in nearly all of China’s ports from January to March.
Just as trade shipping began to pick up in China, the United States and Europe were hit hard by the pandemic. However, shipments have now begun to climb worldwide to compensate for cancellations earlier this year.
The cruise industry, on the other hand, shows little indication of recovery. Cruises were the fastest growing segment of the travel industry over the past five years — until the pandemic hit.
On June 19, the Cruise Line International Association (CLIA) and Centers for Disease Control and Prevention (CDC) announced a “no sail order” for cruise ships. The order has been extended through Sept. 30. Furthermore, the cruise industry’s reputation has been damaged by multiple outbreaks on ships, most recently the MS Roald Amundsen of Norway. At least 43 people were infected on the MS Roald Amundsen, and Norway has now banned cruise ships with more than 100 passengers from disembarking at Norwegian ports.
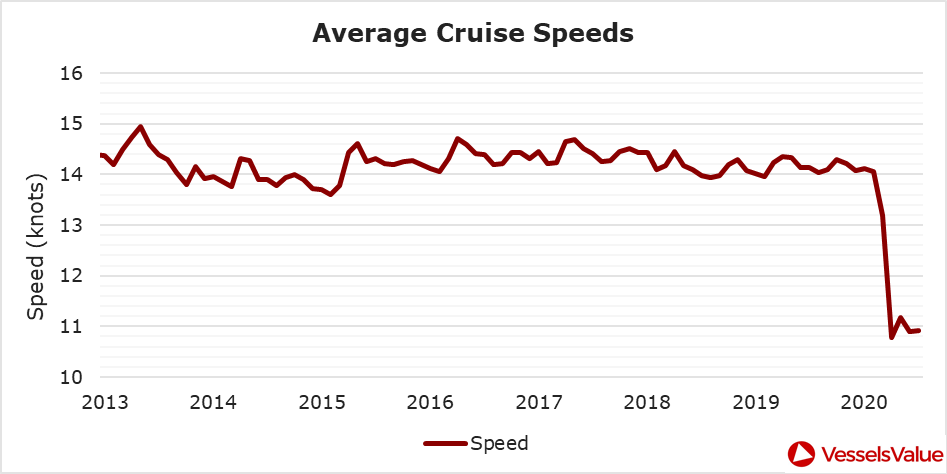
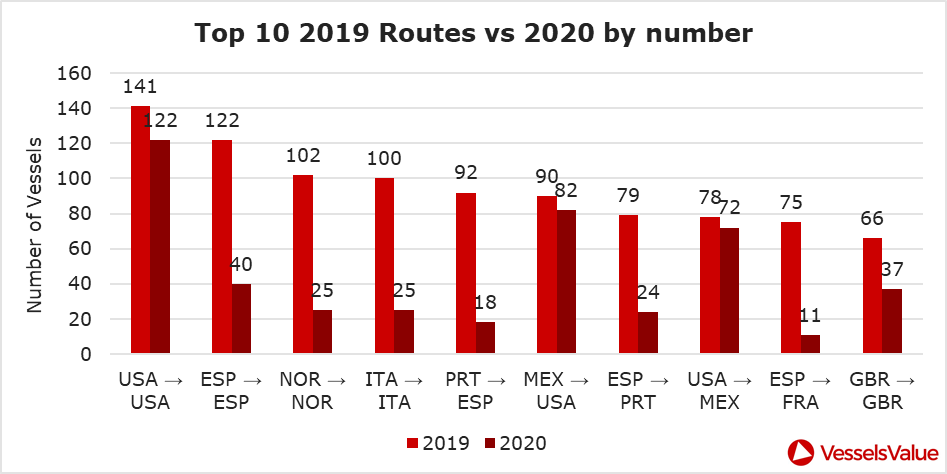
Maritime intelligence company VesselsValue is using AIS data to map cruise ship activity throughout the pandemic. They have noted that while cruise ships typically sail at 13.5 knots to 15 knots, average speed has dropped to 11 knots in 2020 as ships attempt to lower fuel costs. Port-to-port sailings have declined for the 10 most popular cruise routes.
Most of the port-to-port sailings that constitute the 2020 columns in the above graph actually represent ships being repositioned for a break in service, also called a “layup.” Layups can cost cruise companies millions of dollars per month, but with no sail orders and port closures, they are a necessary expense.
According to the Oxford COVID-19 Government Response Tracker, a real-time monitoring system that evaluates government policies, April marked the strictest lockdown measures across all 133 available coastal countries. The tracker uses a stringency index between 0 and 100 based on national containment and closure policies.
Air
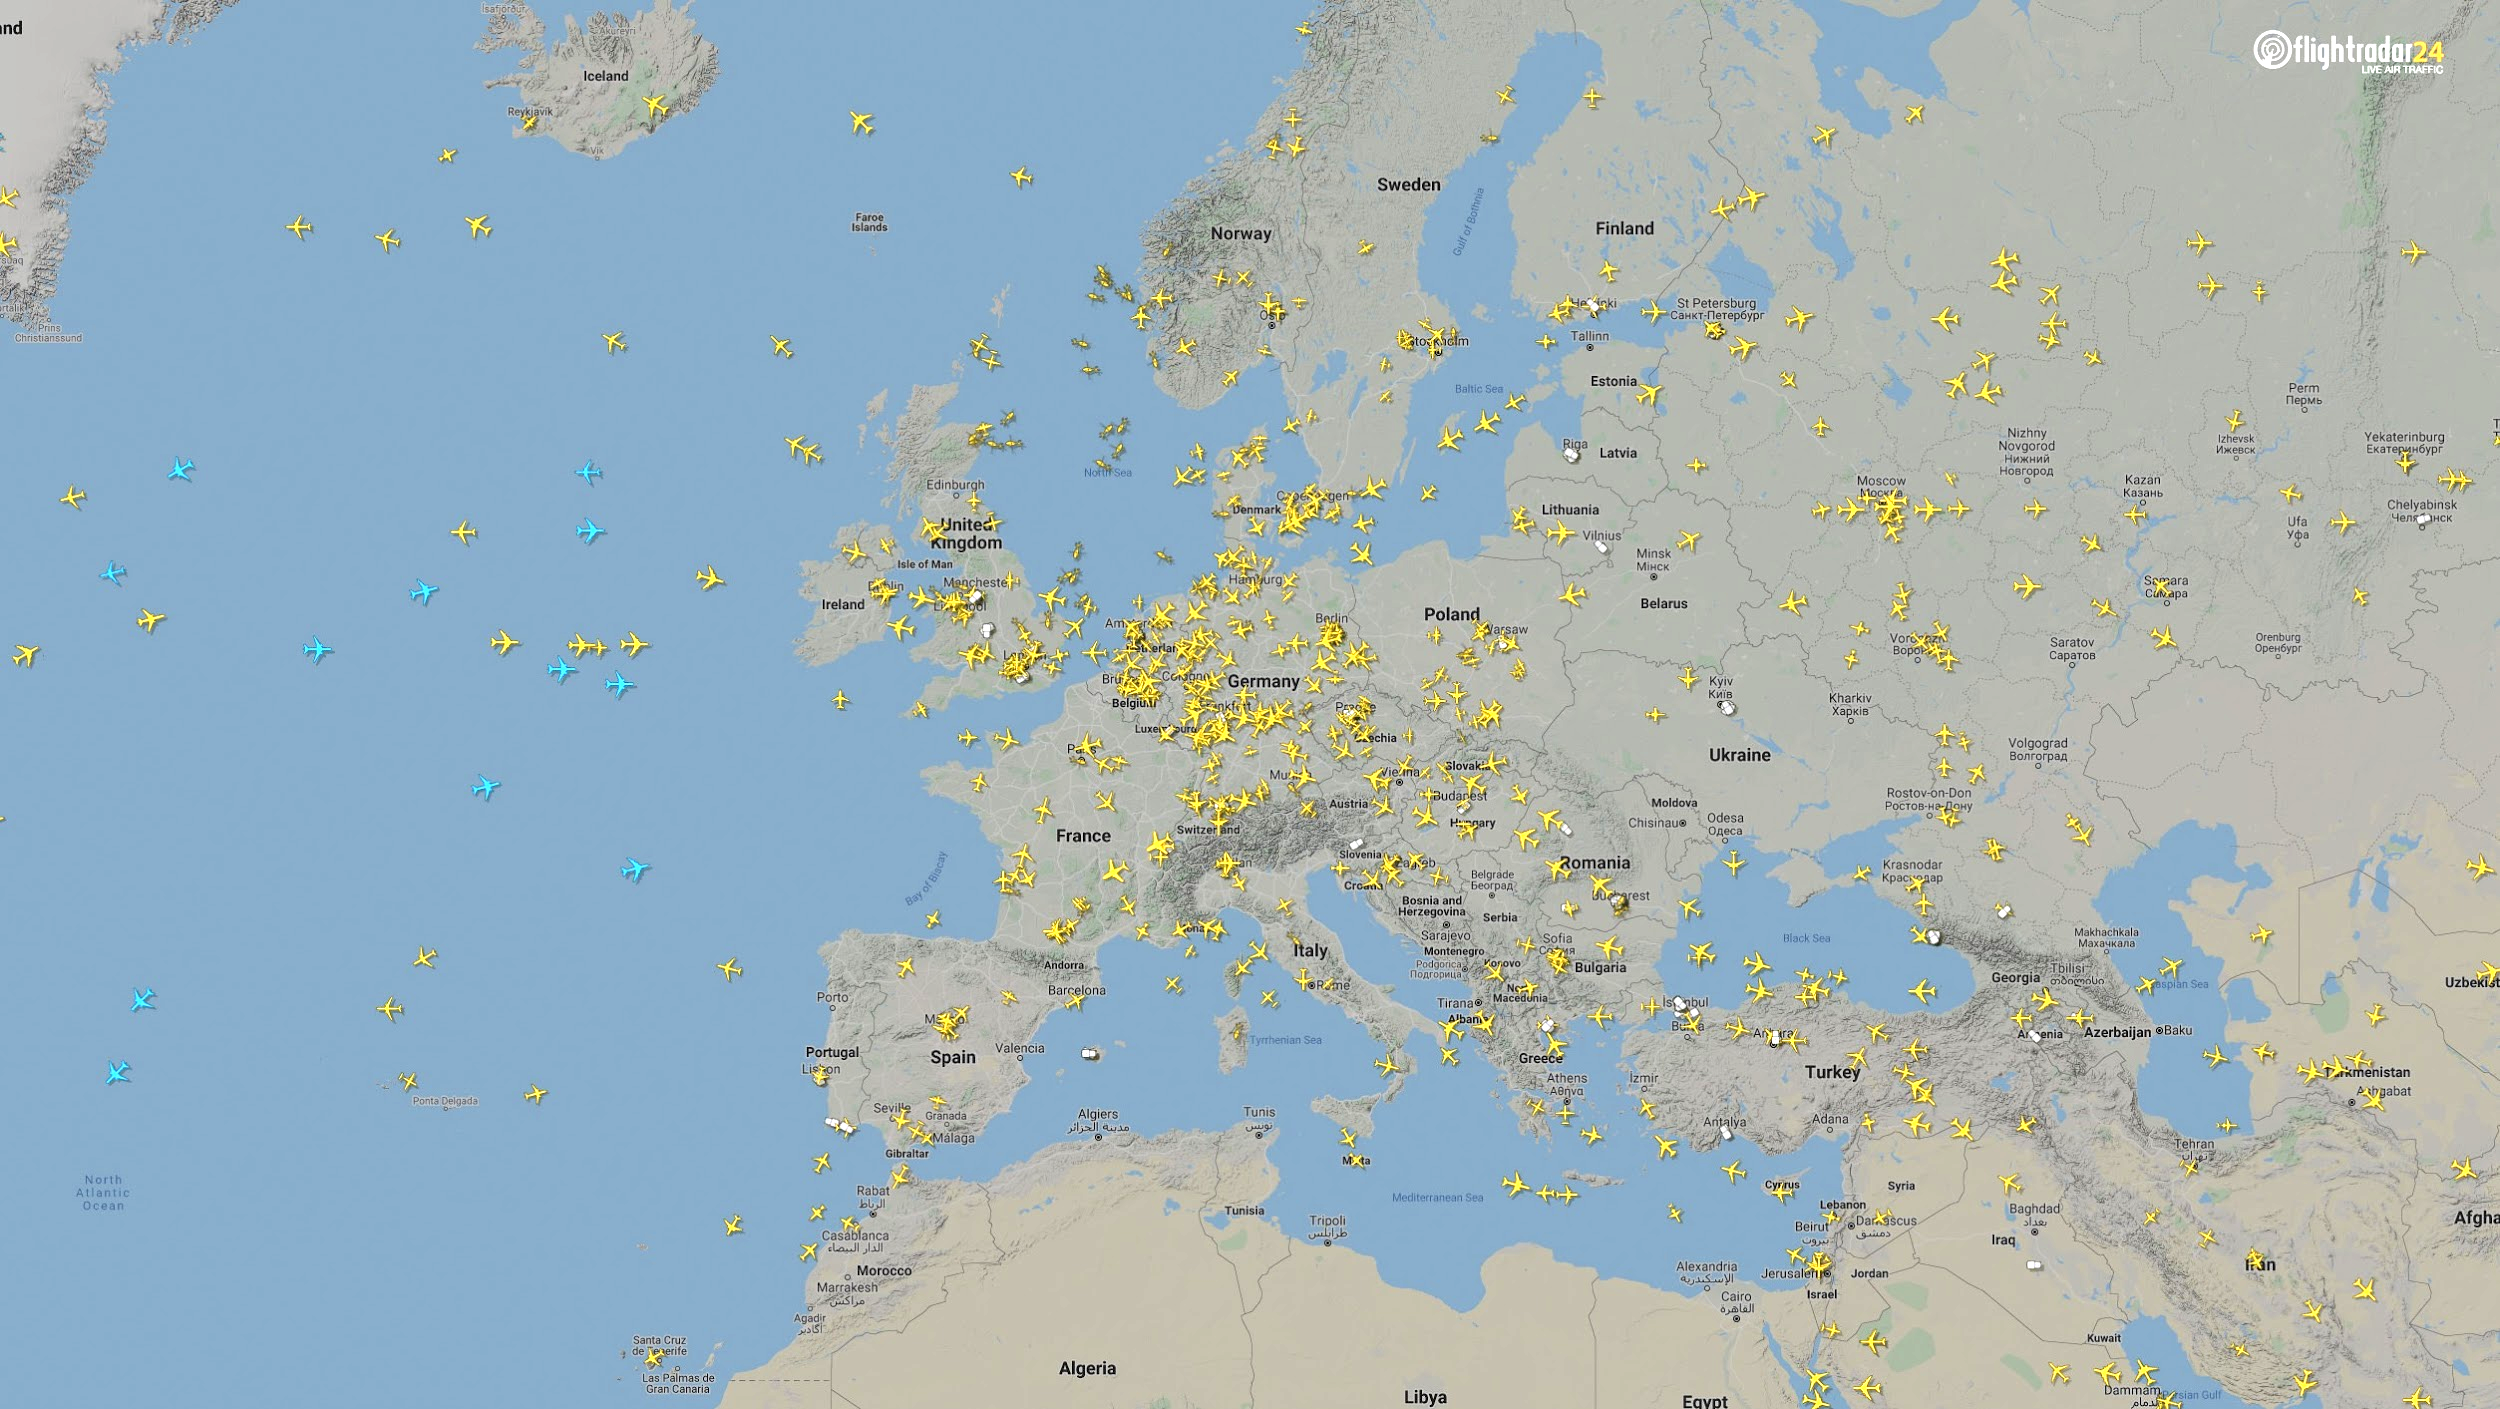
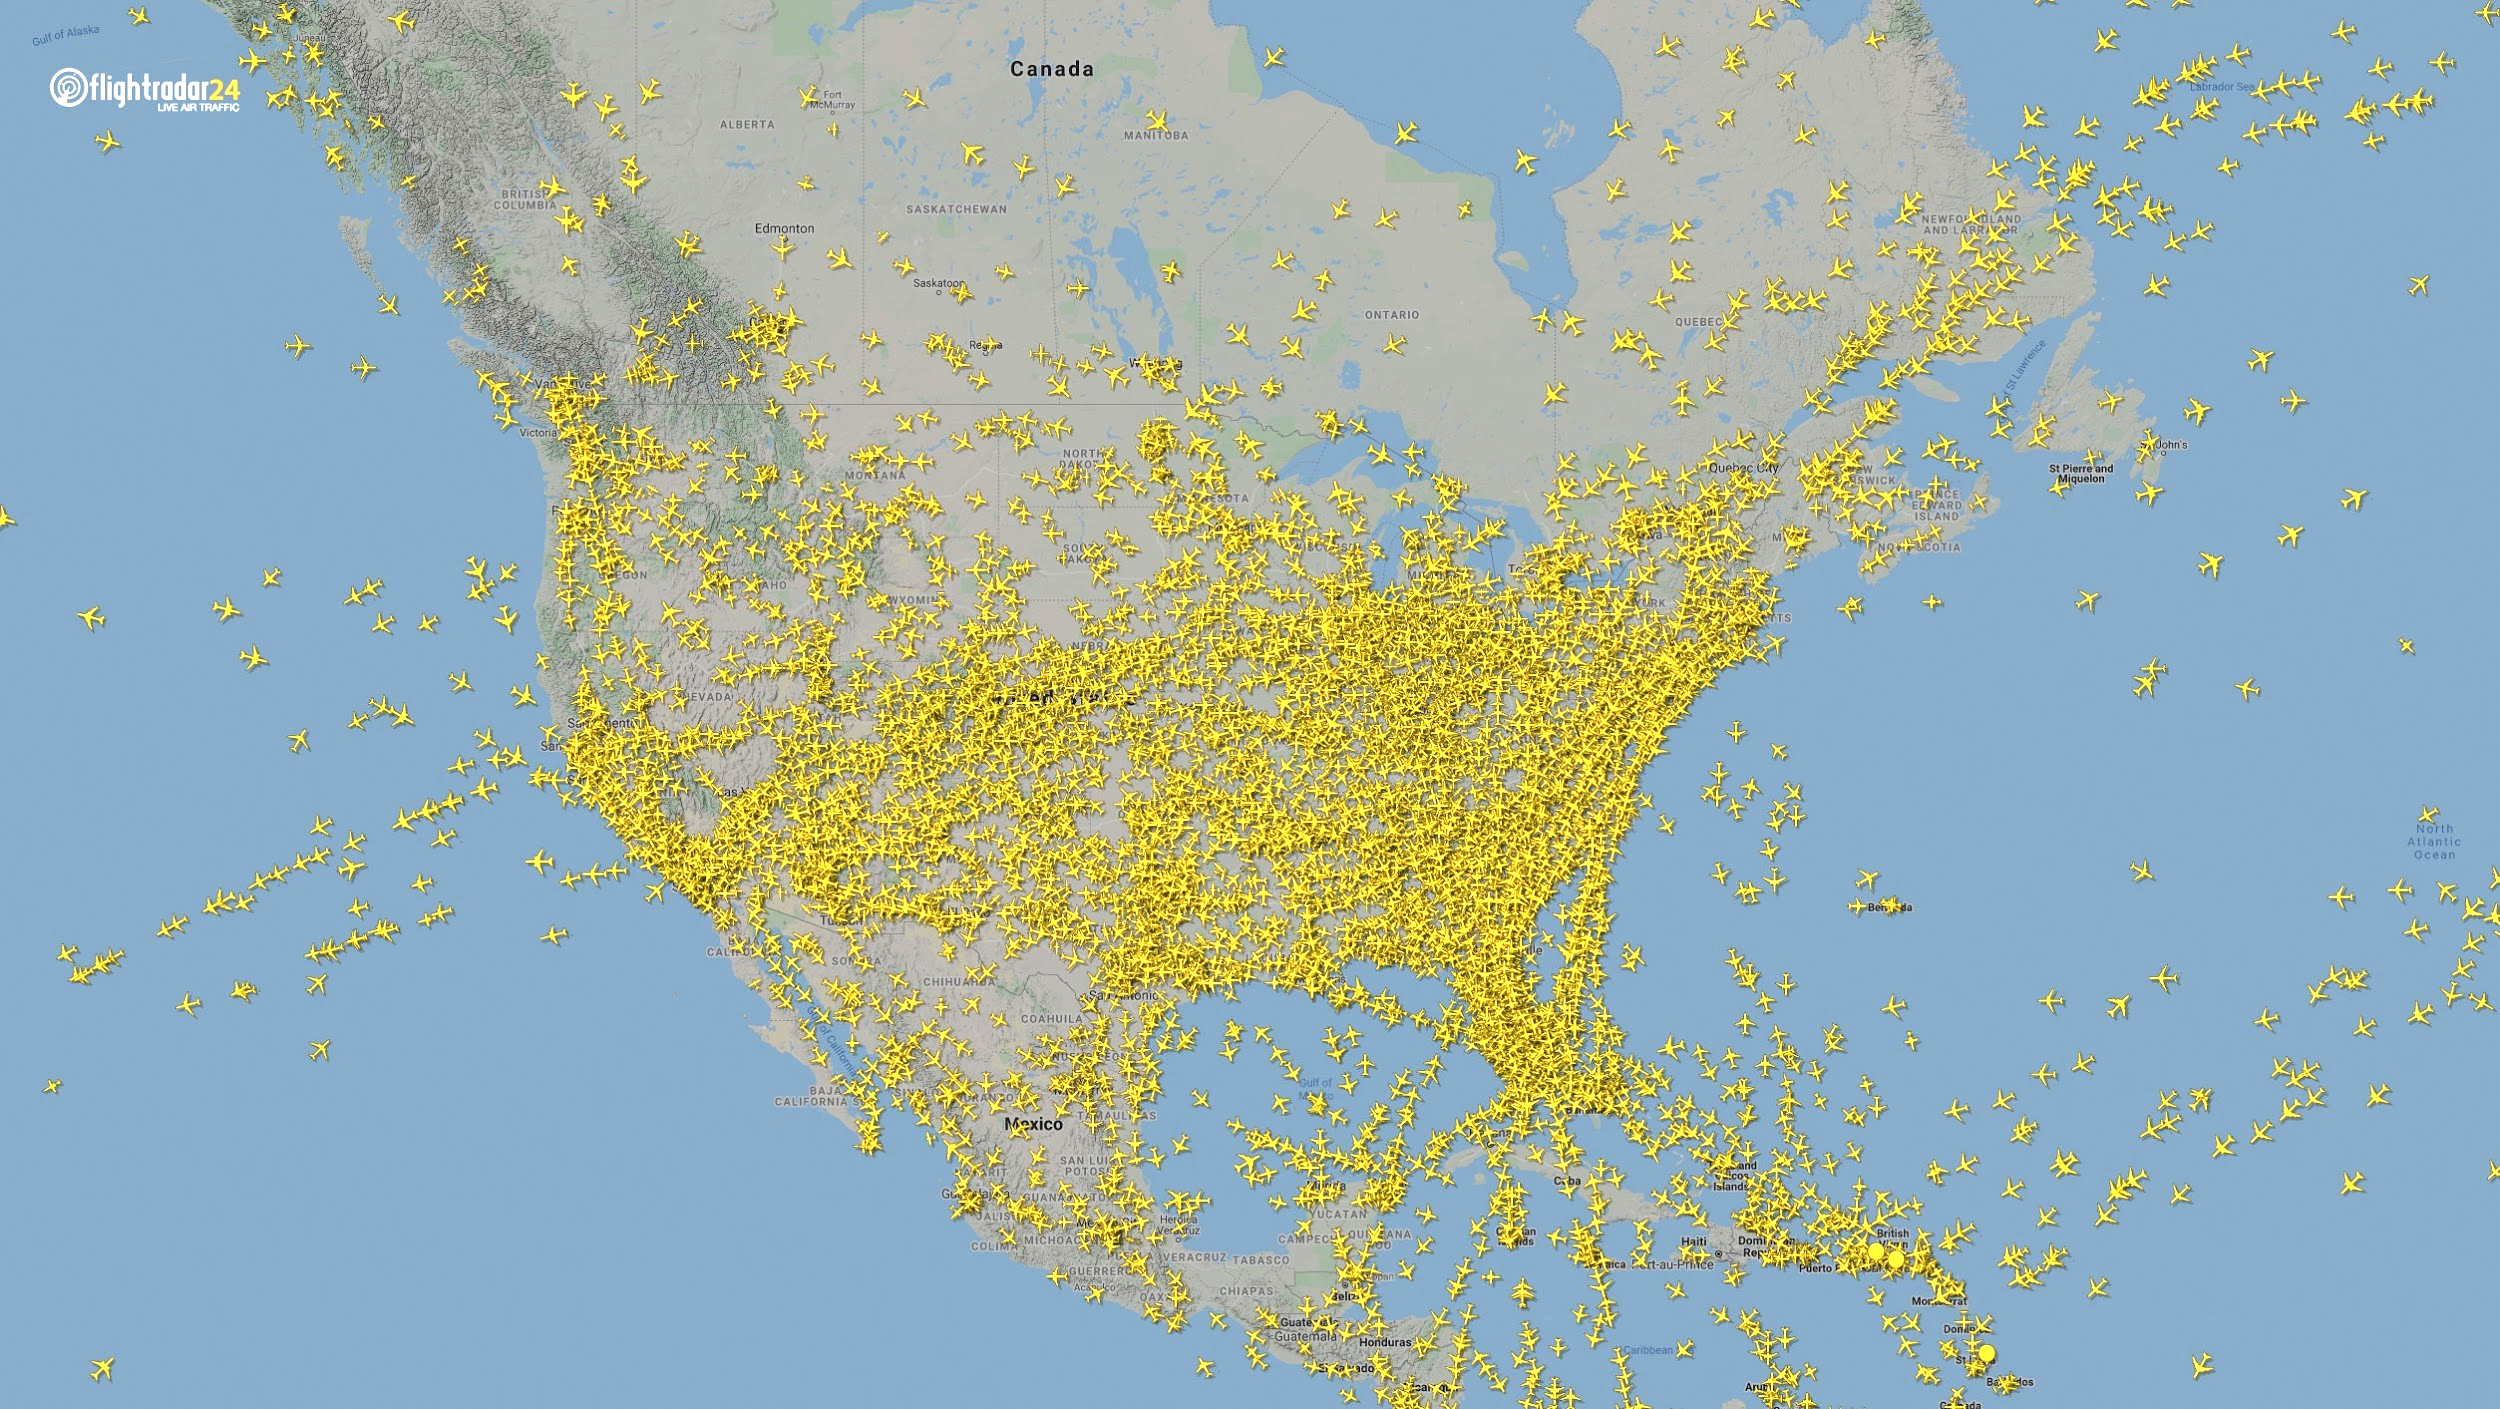
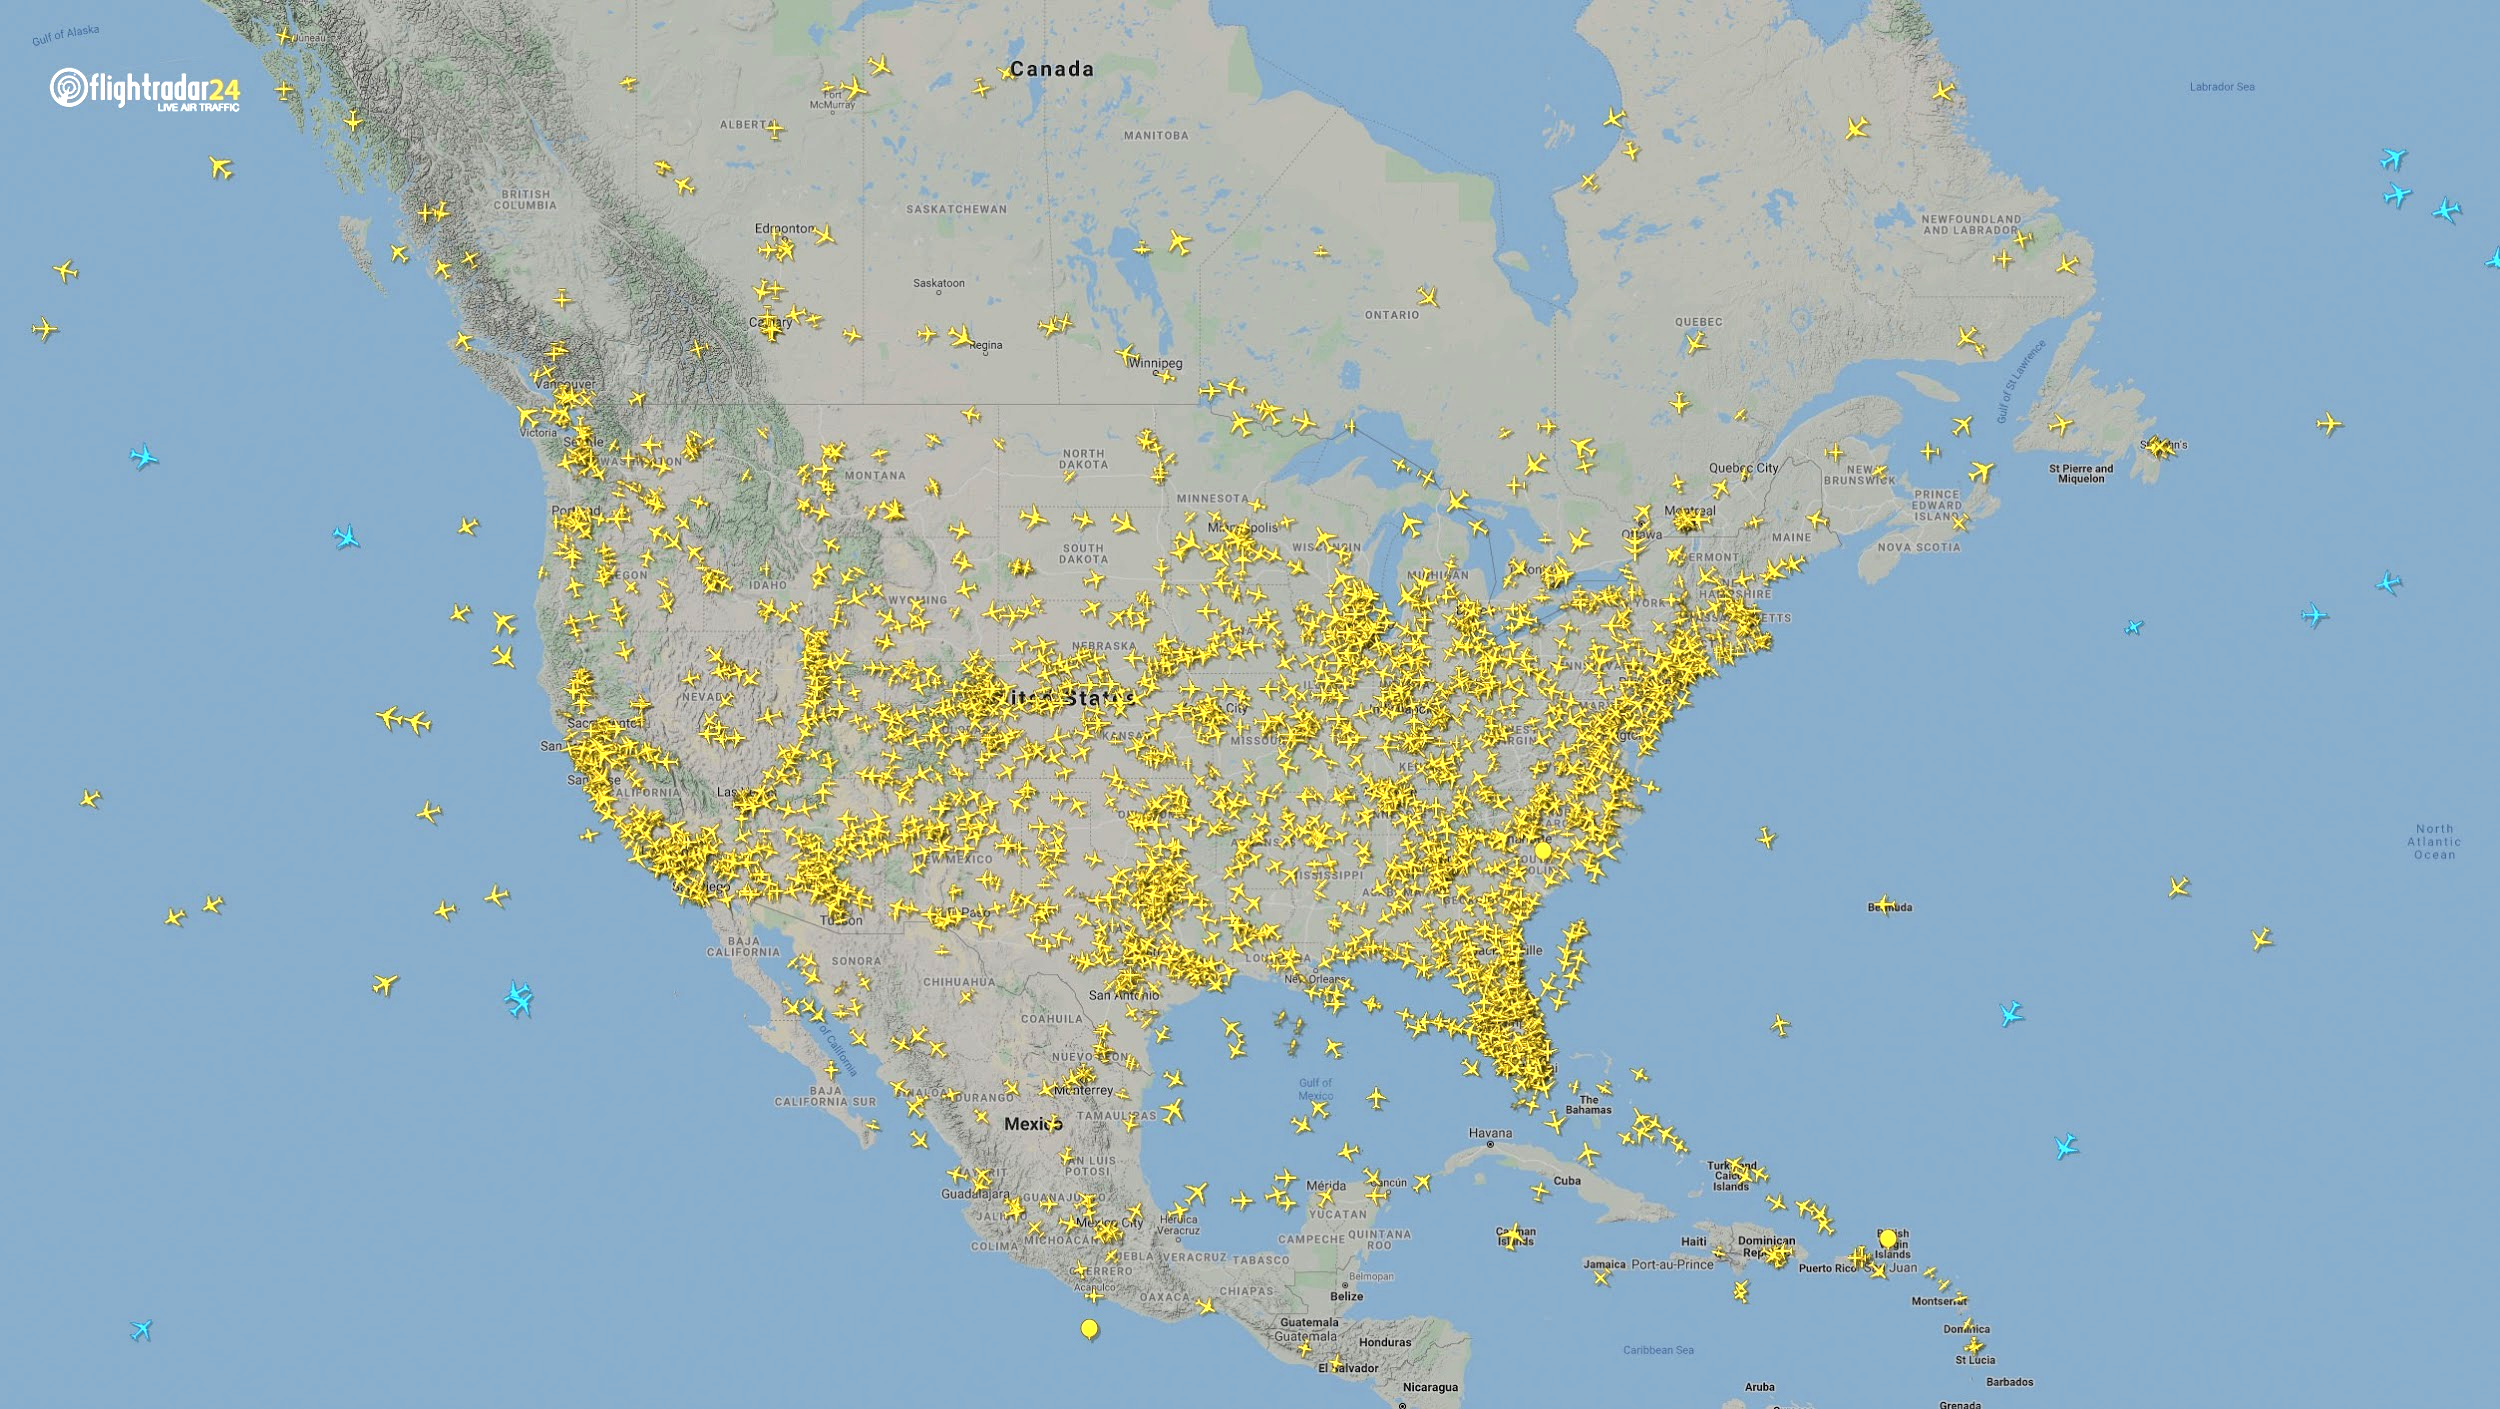
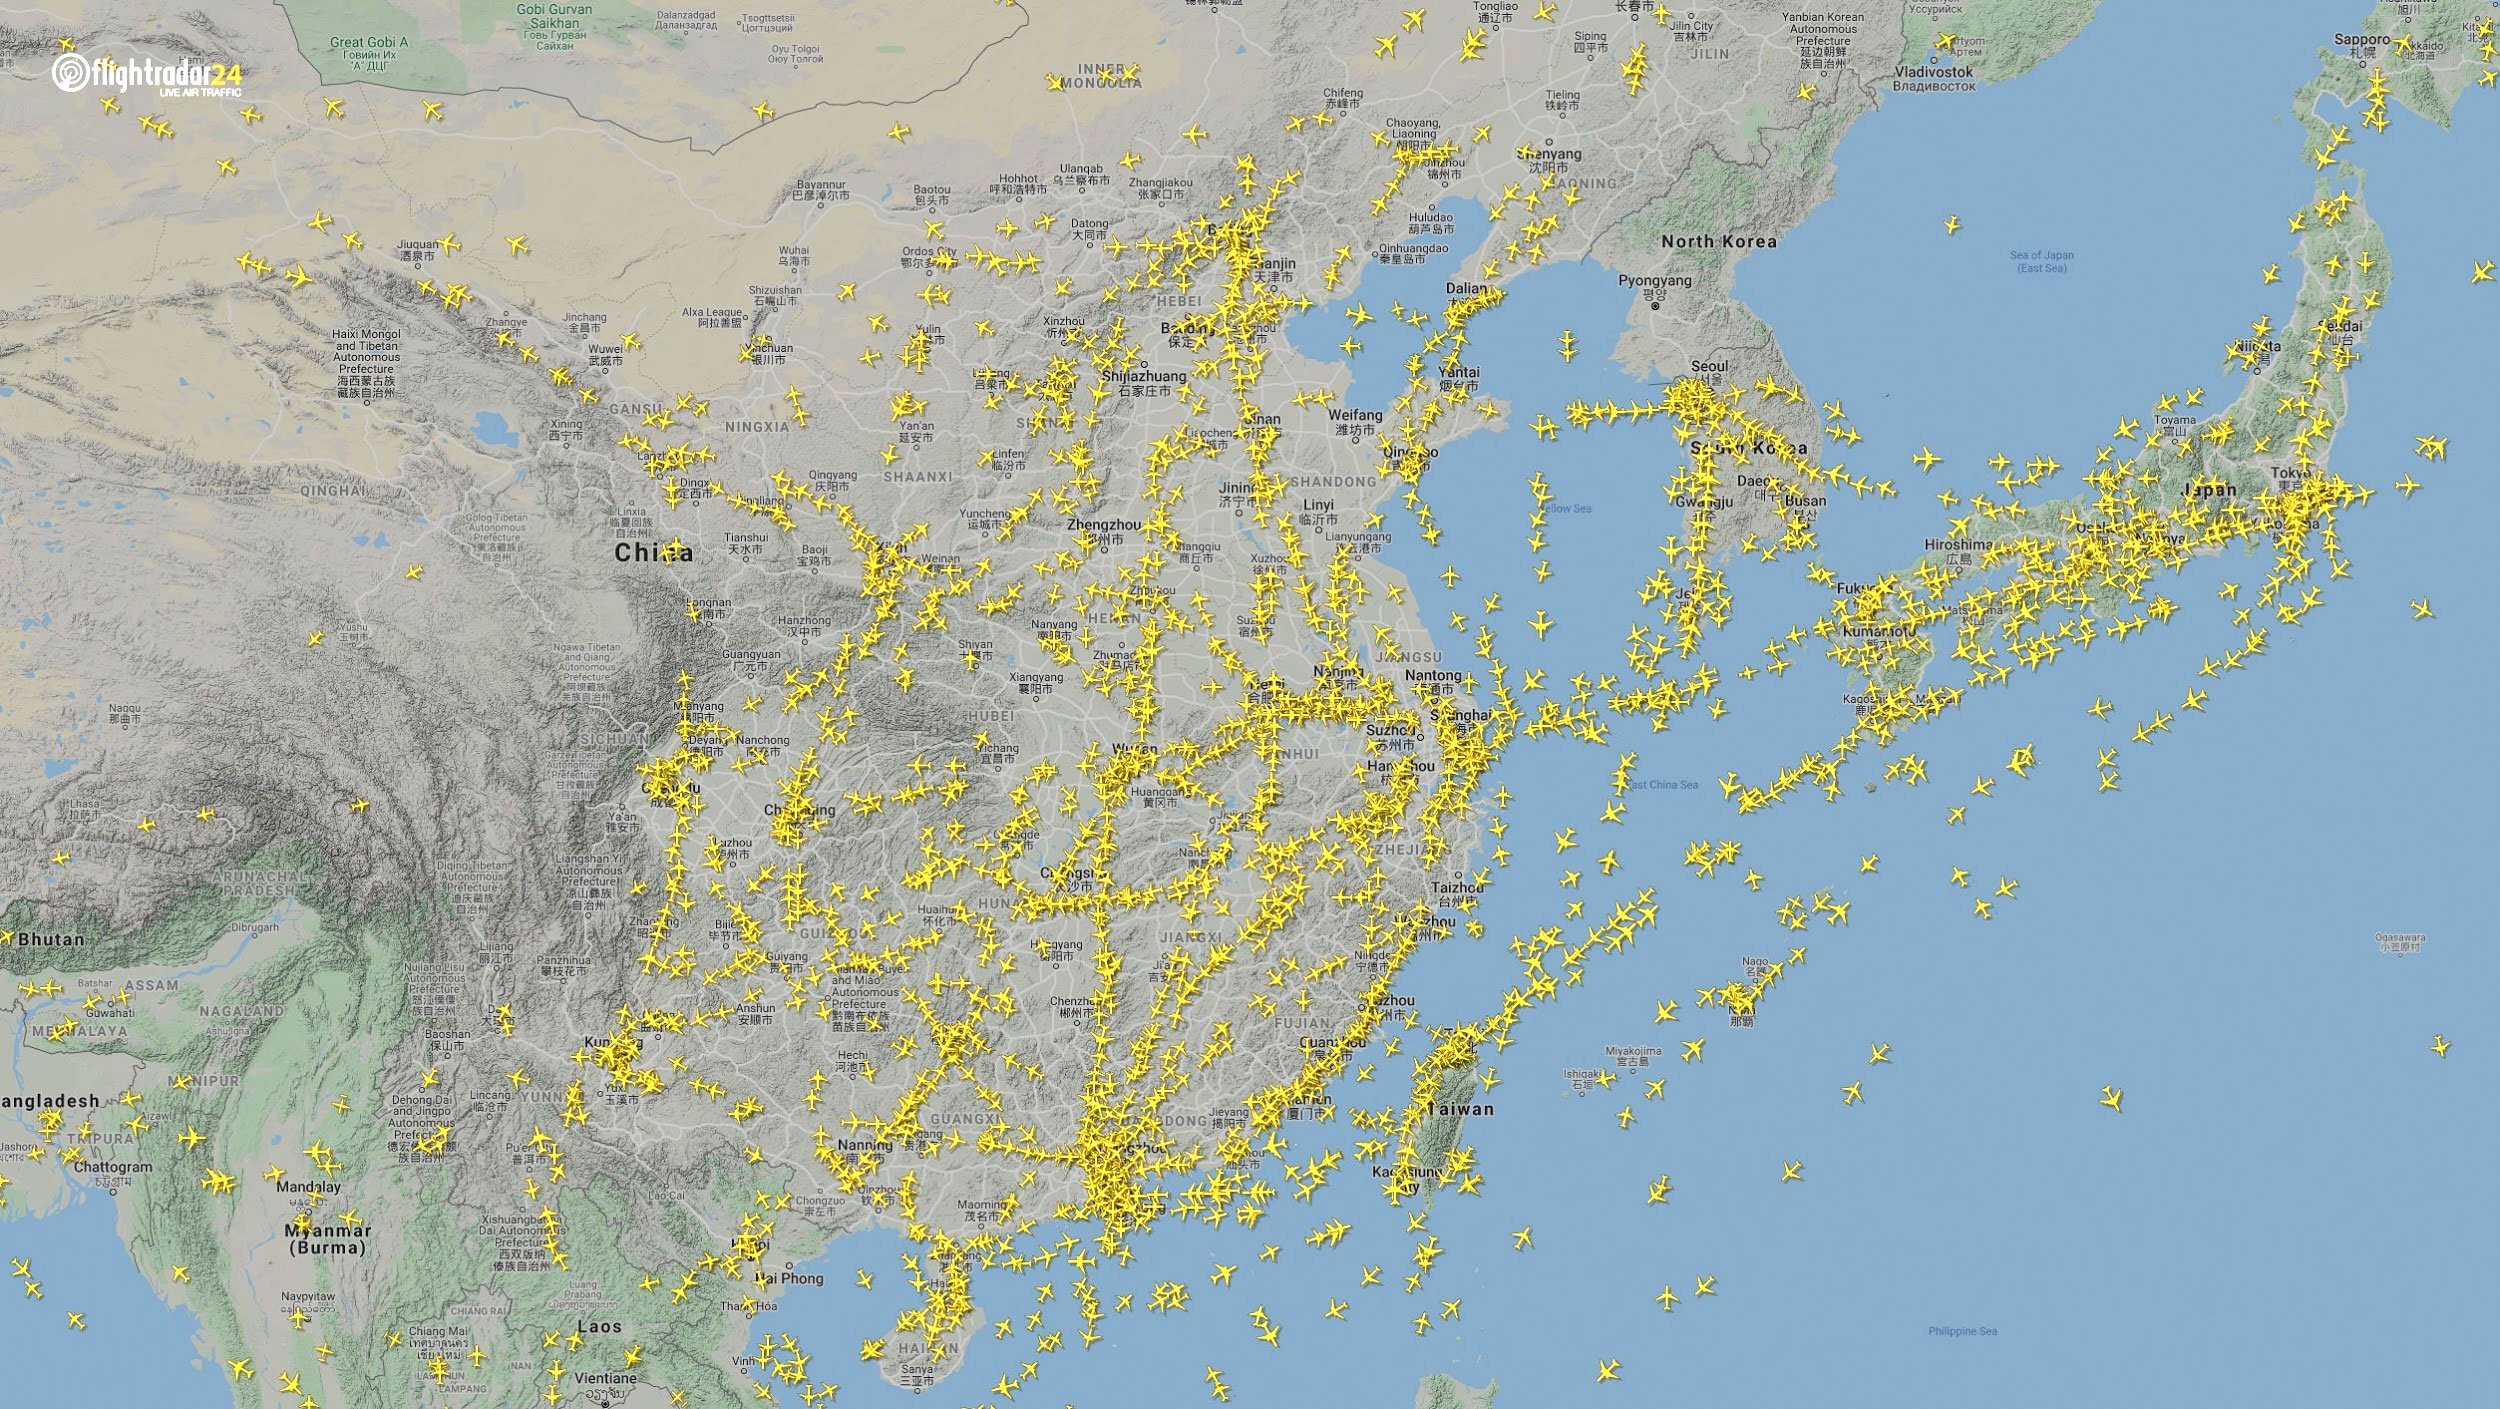
Commercial air traffic has decreased as well. According to GPS flight tracking service Flightradar24, the number of global daily flights was slashed by nearly two thirds between March and April. While there were 15,012 flights in the air at 15:00 UTC on March 7, there were only 5,275 at the same time on April 7.
There were 55% fewer flights in the last week of March 2020 than in the last week of March 2019. While all types of air traffic have been reduced for fears of infection, the coronavirus has especially decimated demand for passenger flights. Passenger airlines across the world have canceled flights and cut capacity for the foreseeable future. Some passenger airlines have even switched to transporting cargo in a desperate attempt to avoid bankruptcy.
Looking at regional tracking data can further illuminate the impact of COVID-19 on air travel. Travel restrictions and border closures were enacted en masse in late March, though some nations adopted more stringent policies than others.
Europe
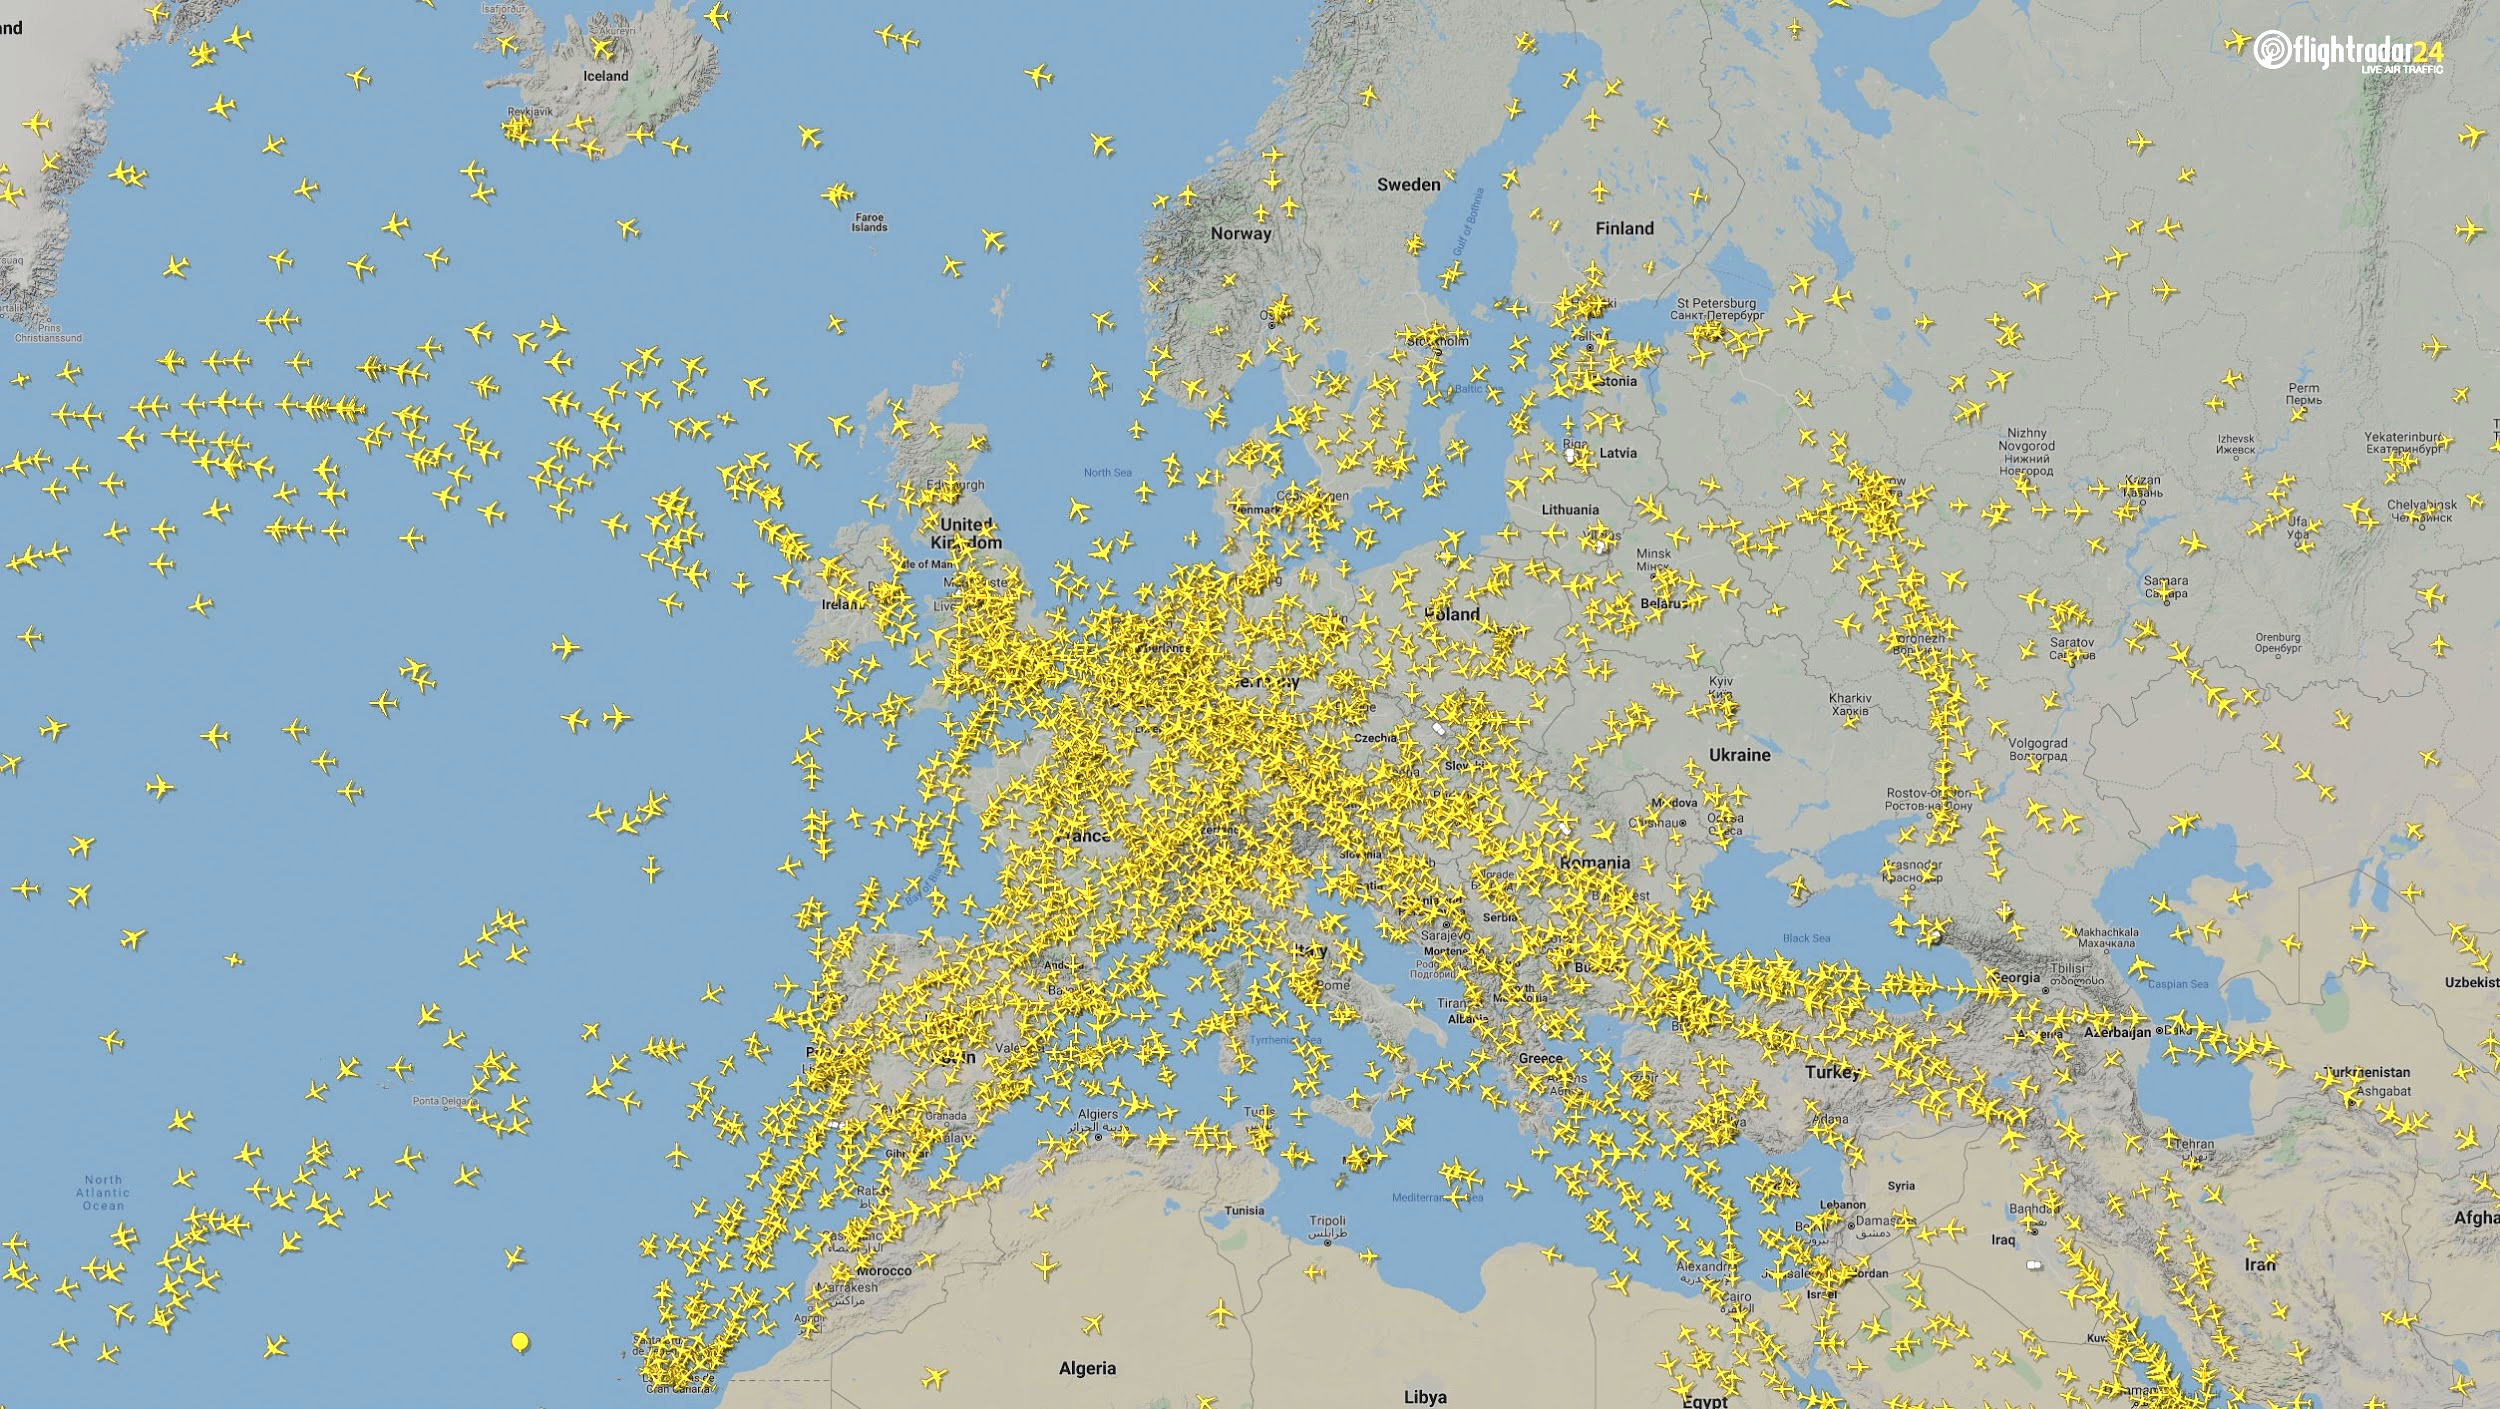
The number of flights in Europe has plummeted since the onset of the coronavirus pandemic. There were 2,400 fewer flights in Europe on April 7 than March 7.
North America
Though air travel has been disrupted across North America, the United States remains significantly more busy than its neighbors. The March 7 image shows 8,400 flights while the April 7 image shows 2,950 flights, most of them concentrated over the United States.
East Asia
The decrease in air traffic over East Asia has been severe and persistent. Since China and its neighbors began to experience a trade downturn as early as the third week of January, we can compare January 7 to April 7 to capture the effects of the coronavirus. As of late July, air traffic at China’s busiest airports was still down approximately 60% from normal levels.
Ground
Google has released — and continues to update — a series of community mobility reports that chart movement trends in public spaces. The reports are a compilation of GPS data for Google users across the world.
Mobility changes are particularly stark for regions hit hard by the coronavirus. New York state showed a 46% reduction in visits to transit stations and a 42% reduction in visits to workplaces in June and July compared to pre-pandemic baseline levels. New Yorkers are also visiting parks 74% more often.
Trends in the United States as a whole are also dramatic.
Israeli journey-planning app Moovit is using mobile phone data to document trends in public transit ridership. Many of the world’s largest metropolitan cities experienced a steep decline in ridership between mid-January and late March. Millions of people that rely on mass transit have had to cope with cumbersome rules and the danger of catching the virus itself. Efforts to reduce overcrowding on trains and buses have translated into reduced capacity requirements and therefore, lengthy wait times. The rise of remote work has also lowered public transit ridership.
Italy was hit particularly hard – and early – by the pandemic. Two large outbreaks occurred in Northern Italy in late February, prompting widespread closures and government-mandated quarantines in Lombardy and 14 neighboring provinces. Public transit ridership plummeted when the quarantine took effect in early March.
Usage of GPS-reliant ride-hailing apps has also dropped severely. Daily installs of China’s three biggest ride-hailing apps were down 75% the week of February 10 compared to the same week in 2019.
American ride-hailing giants Uber and Lyft have seen similar losses. However, business for food delivery apps like Uber Eats and Grubhub are on the rise as more people stay home instead of grocery shopping.
The impacts of COVID-19 have been less severe — but still significant — for the trucking industry. The U.S. trucking industry is an economic powerhouse, typically generating over 700 billion in annual revenue and transporting 72.5% of American freight. The American Transportation Research Institute generated a truck activity index based on GPS data across six states from the week of February 9 to the week of February 12. The data shows an initial spike in trucking operations due to increased demand for consumer goods and medical supplies. However, as stay-at-home orders and restrictions ceased business operations across the country, truck activity declined.
Coronavirus safety restrictions adopted by countries across the world have generally begun to loosen up, for better or for worse. It will be interesting to see how the coming months unfold through the lens of GNSS data.
Roi Mitt works for Regulus Cyber, a company researching GPS cybersecurity and offering various software products to protect the integrity, reliability and security of GNSS devices. The company’s products are designed for multiple industries using GPS-based time and location, in order to ensure a future in which GNSS technology is safe and reliable to use.
Sources
https://www.wto.org/english/news_e/pres20_e/pr855_e.htm
https://thediplomat.com/2020/06/chinas-answer-to-gps-is-now-fully-complete/
https://www.gstatic.com/covid19/mobility/2020-07-21_US_Mobility_Report_en.pdf
https://www.gstatic.com/covid19/mobility/2020-07-21_US_New_York_Mobility_Report_en.pdf
https://www.ttnews.com/articles/trucking-industry-revenue-topped-700-billion-2017-ata-report-shows
https://www.trucking.org/news-insights
https://www.researchgate.net/figure/Figures_fig1_343271722
https://www.cdc.gov/media/releases/2020/s0716-cruise-ship-no-sail-order.html
The Cruise industry’s COVID-19 crisis: how bad is it really?




Follow Us