No audio available for this content.
My February 2020 column provided an analysis of the differences between the latest published hybrid Geoid18 values provided on NGS’ Datasheet and the computed geoid height value using the published NAD 83 (2011) ellipsoid height and NAVD 88 orthometric height. The column highlighted issues on differences due to published heights that have changed since the database pull for Geoid18. It mentioned that future columns will address differences in other portions of CONUS. This column will focus on differences between published Geoid18 values and Geoid12B values in Southern Louisiana. Why are users seeing large differences between the two models?
My last column mentioned that the technical report on Geoid18 provided a good explanation on the stations used in the United States Gulf Coast region. See box titled “GPS on Bench Marks for GEOID18 in the Gulf Coast Region.”
GPS on Bench Marks for GEOID18 in the Gulf Coast Region(https://www.ngs.noaa.gov/GEOID/GEOID18/geoid18_tech_details.shtml)
|
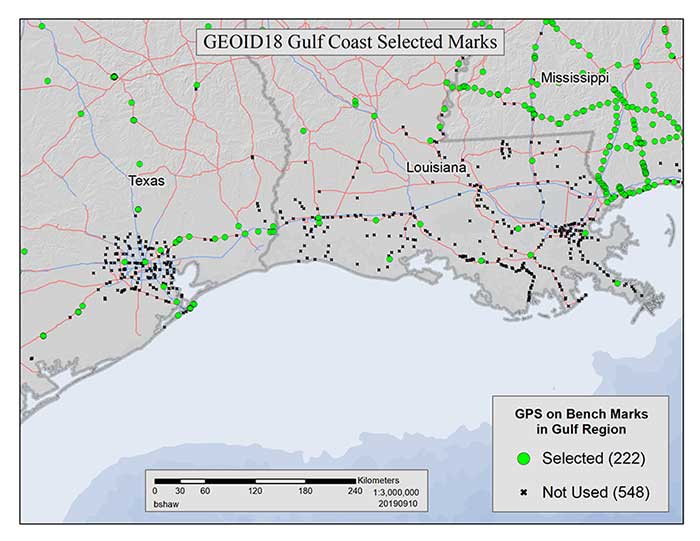
As highlighted in the last column, very few stations in Southern Louisiana were used in the creation of the Geoid18 hybrid geoid model. As provided in my last column the box titled “Differences on GPS on Bench Marks in the Gulf Coast Region” depicts the differences between the published Geoid18 value and the computed geoid value using the latest NAD 83 (2011) ellipsoid and NAVD 88 orthometric height.
Differences on GPS on Bench Marks in the Gulf Coast Region
|
The plot indicates that there are many large differences. Many of these differences are to be expected because the Southern Louisiana is an area of known crustal movement. NGS recognizes this and includes the statement below on datasheets for stations published in Southern Louisiana (see box titled “Statement on NGS Datasheet for Stations in Southern Louisiana”).
Statement on NGS Datasheet for Stations in Southern LouisianaThis station is in an area of known vertical motion. Due to the variability of land subsidence, uplift, and crustal motion, NGS has, determined the orthometric heights for marks in these suspect subsidence areas should be considered valid only at the epoch date associated with the orthometric height. These heights must always be validated when used as control. All previously superseded orthometric heights are now considered suspect and are available in the superseded section. NGS does not recommend using suspect or superseded heights as control. |
As stated above, Southern Louisiana is an area of crustal movement. There have been many reports that have described the crustal movement in this region. A few examples include “Vulnerability of Louisiana’s coastal wetlands to present-day rates of relative sea-level rise,” “A New Subsidence Map for Coastal Louisiana,” “Spatio-temporal Modeling of Louisiana Land Subsidence Using High-resolution Geo-spatial Data,” “Anthropogenic and geologic influences on subsidence in the vicinity of New Orleans, Louisiana” and “Rates of Vertical Displacement at Bench Marks in the Lower Mississippi Valley and the Northern Gulf Coast.” The figure in the box title “Figure 1 from A New Subsidence Map for Coastal Louisiana,” from a 2017 report, provides an estimate of the subsidence in coastal Louisiana.
Looking at the figure indicates that there is a significant variation of subsidence occurring in coastal Louisiana. The legend indicates that the subsidence rates range between 0.6 to 1.2 cm/year.
Figure 1 from A New Subsidence Map for Coastal Louisiana(https://www.geosociety.org/gsatoday/groundwork/G337GW/GSATG337GW.pdf)
|

The box titled “Excerpt from Anthropogenic and Geologic Influences on Subsidence in the Vicinity of New Orleans, Louisiana” depicts estimates of crustal movement between 2009 and 2012 in the vicinity of New Orleans. Several of the areas in the plot indicate subsidence rates exceeding -1 cm/year. Once again, the figure shows the local variability of subsidence rates.
Excerpt from Anthropogenic and Geologic Influences on Subsidence in the Vicinity of New Orleans, LouisianaCheck out page 5 of this PDF. |
Last year, NGS performed the Multi-Year CORS Solution 2 (MYCS2). This was described in previous columns, which can be viewed here and here. The MYCS2 process generated computed and modeled velocities for CORSs. The box titled “CORS NAD83 (2011) Vu Velocities” is a plot that depicts the velocities in the “upward” component in cm/year for NOAA CORS that are operational and have a computed velocity in Southern Louisiana. So, what does this mean to estimating a hybrid geoid model in Southern Louisiana?
CORS NAD83 (2011) Vu Velocities
|
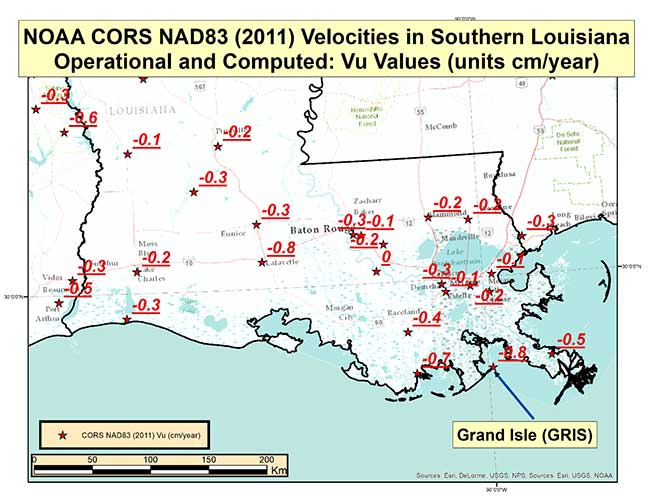
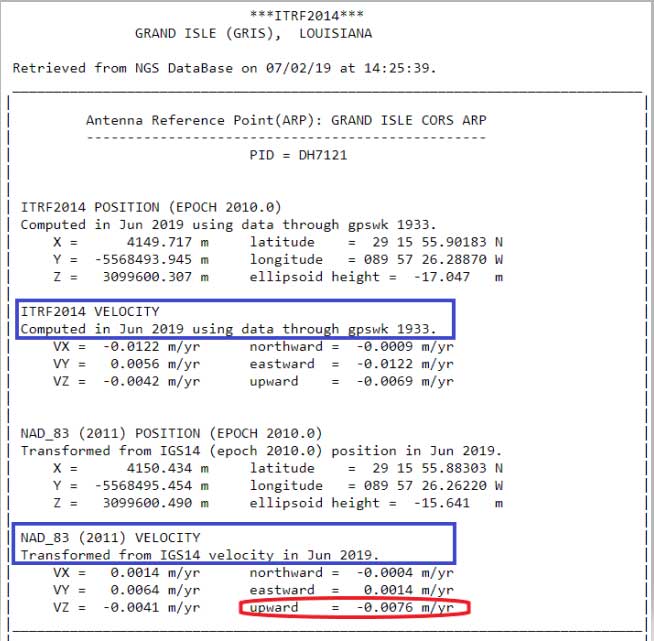
The plot indicates that the rates vary from -0.1 cm to -0.8 cm. It should be noted that these stations are CORS and they are typically installed on structures that may not capture the entire amount of subsidence at the land surface. The box titled “CORS Position and Velocity for Station GRIS” provides an example of a CORS sheet from NGS CORS website.
CORS Position and Velocity for Station GRIS(https://www.ngs.noaa.gov/cgi-cors/CorsSidebarSelect.prl?site=gris&option=Coordinates14)
|
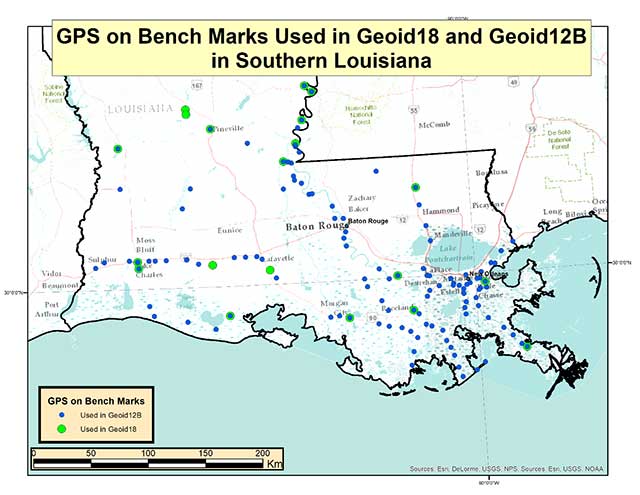
Now, let’s look at differences between Geoid12B and Geoid18 in Southern Louisiana. The box titled “GPS on Bench Marks Used in Geoid18 and Geoid12B” depicts the stations used in Geoid12 and those used in Geoid 18. As indicated in the plots, there were a lot more stations used in the generation of the Geoid12B model than those used to create the Geoid18 model.
GPS on Bench Marks Used in Geoid18 and Geoid12B
|
The box titled “Differences between Geoid12B and Geoid18 in Southern Louisiana” provides the values of Geoid12B minus Geoid18 in centimeters on the GPS in Bench Mark stations used in Geoid12B.
Differences between Geoid12B and Geoid18 in Southern Louisiana
|
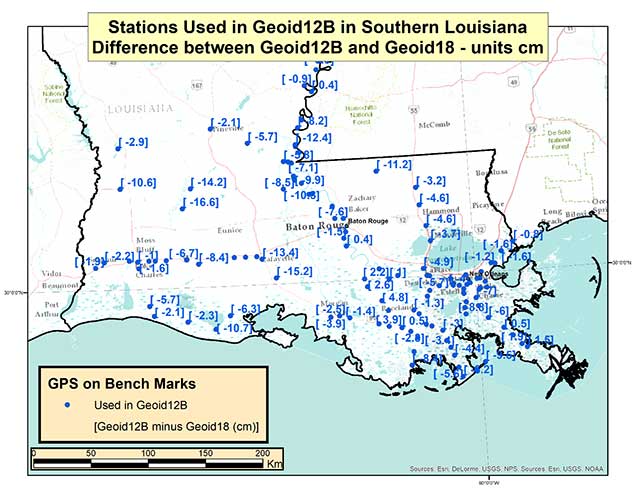
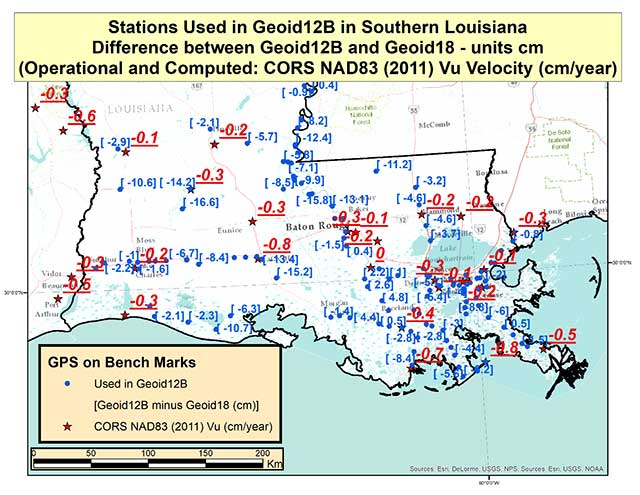
As indicated in the plot, there are some large differences between Geoid12B and Geoid18 values; a few differences exceed 15 centimeters. Based on the previous discussion of crustal movement in Southern Louisiana, this probably shouldn’t come as a surprise. The box titled “Differences between Geoid12B and Geoid18 with Vu Velocity Values” depicts the differences in the hybrid geoid models and the NAD83 (2011) CORS Vu rate.
Differences between Geoid12B and Geoid18 with Vu Velocity Values
|
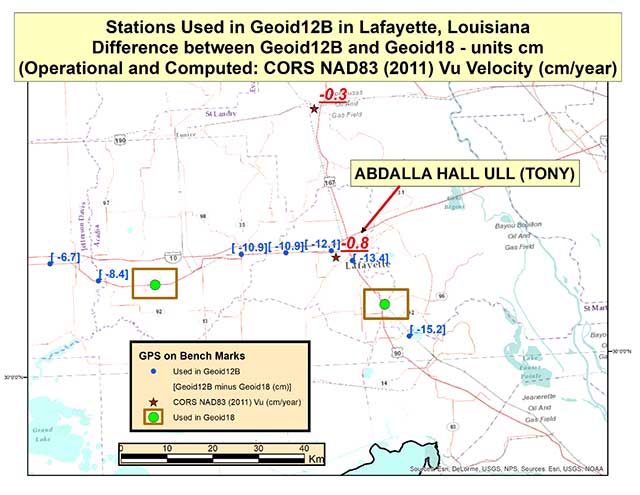
The box titled “Differences between Geoid12B and Geoid18 in Lafayette, Louisiana” depicts the differences in the two hybrid geoid models and the NAD83 (2011) CORS Vu rate values in the Lafayette, Louisiana, region. This region has some of the largest differences between Geoid12B and Geoid18 values in Southern Louisiana. As indicated in the plot, CORS station TONY has a Vu rate of -0.8 cm/year which is fairly large, and the differences between Geoid12B and Geoid18 values are fairly large at the -10 to -15 cm level. Once again, users should expect differences between the two hybrid geoid models because there has been movement in the area and because different GPS on Bench Mark stations were used in the generation of the hybrid geoid models. In the Lafayette region the two stations used in the generation of Geoid18 were not used in Geoid12B (see stations highlighted in a box).
Differences between Geoid12B and Geoid18 in Lafayette, Louisiana
|
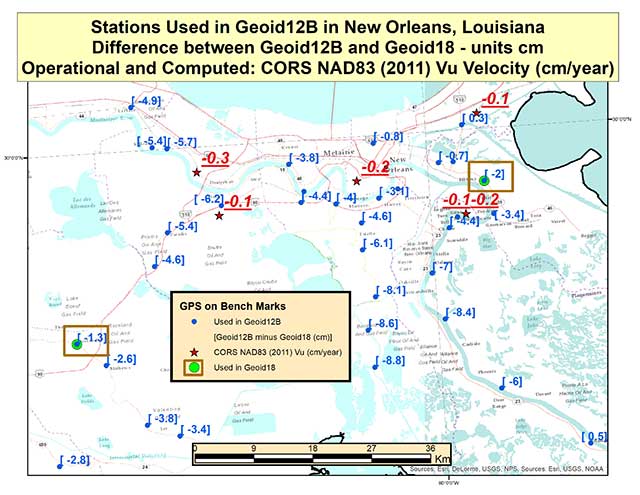
The box titled “Differences between Geoid12B and Geoid18 in New Orleans, Louisiana” depicts the differences in the hybrid geoid models and the NAD83 (2011) CORS Vu rate values in the New Orleans, Louisiana, region. Two of the same stations that were used in the development of Geoid12B and Geoid18 are highlighted with a box. The difference between the two geoid model values are much less in this region compared with the Lafayette region. The CORS Vu velocities are also less than the CORS station (TONY) value in Lafayette. Saying that, the differences on stations not used in Geoid18 have differences ranging from -4 to -8 cm going southward toward the Gulf of Mexico. Once again, Southern Louisiana is subsiding so these differences are not surprising.
Differences between Geoid12B and Geoid18 in New Orleans, Louisiana
|
This means if someone uses NGS’ OPUS web tool to compute a GNSS-derived orthometric height, the NAVD 88 GNSS-derived orthometric height could be significantly different than the published stations in this region. Some of the difference could be due to the difference between the Geoid12B and Geoid18 published values, and some could be due to crustal movement in Southern Louisiana. Saying that, I mentioned in my last column that NGS performed a large GNSS network project in Southern Louisiana in 2016. The GNSS-derived ellipsoid heights were loaded in NGS’ database in March 2019, but the GNSS-derived orthometric height from the 2016 project are not yet finalized so they have not been loaded into NGS’ database. Once finalized and loaded into the database, the 2016 GNSS-derived orthometric heights should be more consistent with GNSS-derived orthometric heights estimated using the NGS’ OPUS web tool. This column focused on differences between published Geoid18 values and Geoid12B values in Southern Louisiana. It provided reasons why users may see large differences between the two models.