No audio available for this content.
An Esri Storymap provides a quick snapshot of the raging fires across the United States and provides context to the severity of the California fires.
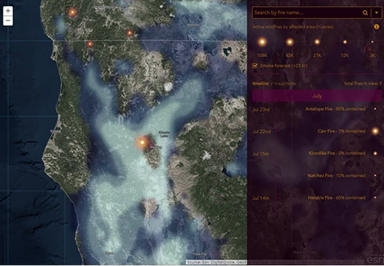
The interactive map can be explored by panning and zooming. Click on a fire and information about that particular fire is displayed including the start date, containment and links to the latest news and social information.
Esri Story Maps let users combine authoritative maps with text, images and multimedia content. It harnesses the power of maps and geography to tell a story in an easy and understandable format, the company said.
The Story Map uses the ArcGIS Javascript API and is linked to interactive timelines and magnitude displays. The cartography uses AGOL Firefly symbology — radial gradients — and a dark basemap.
The fires and perimeters are a service of the GeoMAC community that uses the Geospatial Multi-Agency Coordination, an internet-based mapping application that is designed for fire managers to access online maps of current fire locations and perimeters in the United States.
Members of GeoMAC include:
- U.S. Geological Survey
- National Interagency Fire Center
- National Weather Service
- Bureau of Land Management
- Remote Sensing Application Center
- National Geophysical Data Center.
The data is updated manually based on information from a host of sources including those on the ground. Typically, the data is fresh to about 24 hours, but there is variability because it is a carefully curated process.
Diving deeper for information
Esri has updated the app based on feedback from many different groups including firefighting professionals, those directly affected by fires, and those concerned about loved ones affected by fires. Some of the updates include the addition of the National Weather Service (NWS) animated smoke risk forecast, visualized to more directly represent smoke (see below).
Another is the addition at finer scales of satellite-detected hot spots to indicate fire direction — sensors. Many Earth-observing satellites contain sensors capable of detecting the infrared energy released by fires. Not only can the hotspots be located, but areas of burned land can also be identified based both on their thermal characteristics and visible appearance. In Esri’s ArcGIS Living Atlas of the World, the MODIS Thermal Activity layer provides daily updated global hotspot locations.
In the U.S., the USA Wildfire Activity layer in the Living Atlas provides a more quality controlled version of the data. It shows only wildfires submitted to the USGS by fire agencies, as opposed to all of the other events that can cause an automated satellite-based hotspot detection. However, since this layer relies on human analysis, sometimes it doesn’t update as frequently as the MODIS hotspots. The layer also contains the perimeter of the fire area. Both current (active) and older (inactive) fires are included.
While the weather-focused satellites from NOAA and NASA provide high temporal resolution fire data, really detailed analysis of the fire impact is often left to moderate resolution multispectral imaging satellites such as Landsat 8 and Sentinel-2, or commercial high-resolution satellites. That is the benefit of the multispectral capabilities of the Sentinel-2 satellite, now available in the Living Atlas. Sentinel-2’s infrared sensitivity (Channel 12; 2.19 micron band) provides the ability to identify areas of active fires, much like NOAA-20 or Aqua/Terra, but at 20m resolution.
In addition to visualizing active fire areas, multispectral imagery is also effective at assessing burn scars. Besides the ecosystem impact, denuded vegetation along sloped areas can lead to landslides, especially when combined with heavy rains.