No audio available for this content.
By Eric Gakstatter
It’s been a few months since I’ve published a GSS Monthly newsletter column. What a busy few months it has been. It’s been all about UAVs, high-precision GNSS projects and GIS, with some conferences and workshops sprinkled in between. High-accuracy GNSS technology and UAV technology are hot trends— red hot.
UAVs: Prosumer and mapping on a slope
Obviously, consumer UAVs have exploded in the mainstream consumer electronics market during the past five years. Since the FAA began requiring UAVs to be registered in late 2015, far more UAVs have been registered (~700,000 to date) with the FAA than manned aircraft (~320,000).
In fact, the number of registered UAVs aircraft eclipsed registered manned aircraft more than a year ago! The FAA reported that at any one point during the day, there are ~7,000 manned aircraft flying in the U.S. airspace. That begs the question, how many UAVs are flying above our heads at any one point in time? No one can answer that question.
On the coattails of consumer UAVs in mainstream America is the use of UAVs in the USA’s commercial world. Since the FAA opened the floodgates in August 2016 to allow almost anyone to fly UAVs for business ($150 and answer 42 out of 60 questions correctly), lots and lots of companies are buying inexpensive “prosumer” UAVs and extracting tremendous value from them.
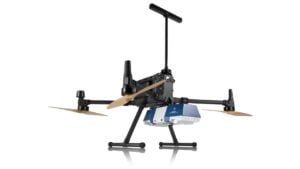
Prosumer electronics is equipment and software targeted at the consumer market but also good enough to be used for business. The UAV market is a perfect example of this. DJI, by far the biggest UAV manufacturer in the world at $1B+ in annual revenue, targets the mainstream consumer market and sells a huge number of low-, medium- and high-end UAVs to businesses. Think about it: You can buy a DJI Phantom 4 Pro at your local Apple Store and the next day be generating one-foot elevation contours on a project site!
Following is an example of a papermill I flew a few weeks ago. I flew it in less than one hour (50 acres), generated an orthophoto with 2.4-cm/pixel resolution and a digital elevation model (DEM) with 4.79-cm/pixel resolution.


The detailed data above, generated from a $1,500 UAV, is clearly outstanding. By the way, the purpose of the project was to determine the volume of the various stockpiles, which I’ve not computed yet. But if the volume calcs are close enough to the traditional terrestrial-based measuring methods, the UAV return on investment (ROI) argument will be hard to beat.
It takes ~14 hours each month to measure all the stockpiles on this site using traditional terrestrial measurement tools. Also, the measurements must be taken on the weekend when the site activity is minimal. It took less than one hour to fly the entire site, and I flew it twice (one time west-east direction at 80/80 overlap and one time north-south at 70/70 overlap) to make sure I had enough data. I mean, seriously, I drove 1.5 hours to the site. Why not spend another 20 minutes to fly it in a perpendicular direction?
To date, I’ve only flown relatively flat sites such as construction sites, agricultural fields, and industrial sites. That was until a couple of weeks ago. While I’ve become pretty comfortable at flying open and relatively flat sites over the past 18 months, I’ve not ventured into flying a site with a lot of elevation changes and tree canopy. I finally did that earlier this month, and it was both challenging and rewarding. There are a few problems on sites with major elevation changes and tall tree canopy:
A. Maintaining visual line of sight (VLOS) as required by the FAA.
B. Flying in such a manner that the image-processing software has good quality data to work with so you can generate the products you need.
The mission planning/control software plays a very important roll in this process. Well, it always does, but it really does in this case. Typically, the mission planning/control folks want you to fly at a consistent height above the ground so your overlap is consistent. This is very difficult to accomplish if you’re flying a site with a lot of elevation change. In that case, they typically tell you to launch from the highest (or nearly the highest) elevation point and fly at that elevation.
The problem this causes is that you could end up flying 500, 600 or 700 feet above ground level (AGL). For example, if you are flying a site with 500 feet of elevation change and you instruct the mission planning/control software to fly at 350 feet AGL, at some point in the project the UAV will be at 850 feet AGL. That can be a problem from both a regulatory standpoint (FAA allows UAV flights up to 400 feet AGL) and an image-processing standpoint.
Fortunately, the mission planning/control software I use just introduced a Terrain Awareness feature. It uses SRTM (Shuttle Radar Topography Mission) elevation data. Granted, it’s 30-meter pixel elevation data, so each elevation block is 30 meters x 30 meters, so I really wondered if the resolution was high enough. The site I was going to fly was only 60 acres in size and had 550 feet of elevation change. Note that the trees on the site had already been harvested, so the land was relatively clear. There’s about a 550-foot difference from the projected launch point (purple dot) to the northern and western end of the site. Following is the mission plan for the site I was planning to fly.

To give you an idea of the slope, the solid red lines in the following image are 100-foot elevation contour lines. The green triangle is the projected UAV launch point. This was a great launch point because I could see the entire site and maintain VLOS.

I chose to fly the mission at 300 feet AGL. I figured it would be high enough if there was some “slop” in the SRTM elevation model. Still, I was concerned about the resolution of the SRTM data because at 300 feet AGL, my UAV would be flying below the launch elevation due to the extreme elevation slope on the site. Remember, the Terrain Awareness feature of the mission planning/control software is based on the SRTM elevation data, and not based on any sensors in the UAV itself — if the SRTM elevation data was incorrect, my UAV might crash into the ground.
Following is the SRTM elevation data along with the flight path data displayed in the mission planning/control software.

The moment of truth came when I launched the UAV from the start point (purple dot) and watched it rise to 300 feet AGL to start its mission. The first few swaths were uneventful. After that, it started to fly into the canyon, following the terrain as programmed, then rise up from the canyon during each pass. It was a thing of beauty to watch.
Unfortunately, about 70% of the way through the mission, it started raining, so we called it quits. However, we proved that at least on the four sites I flew that day, the SRTM data and Terrain Awareness feature were effective in collecting data in steep-slope environments. Following is the 2.69-cm/pixel orthophoto generated from the flight. Note the tracks where the logging rigs pulled the logs up the steep slope.

Following is a zoomed-in view of the UAV launch site.

Following is an image of the 5.37-cm/pixel DEM generated from the flight data. Notice the logging tracks.

Following is a zoomed in view of the 5.37-cm/pixel DEM image.

The mission was successful in proving that SRTM elevation data was sufficient enough to fly a mission with a dynamic AGL. It handled the steep slopes by maintaining a sufficient AGL elevation as I hoped it would despite only having 30-meter x 30-meter block elevation resolution. The image processing software seemed to like the UAV data, as you can see from the results above. I didn’t have to spend any additional processing time over and above what I usually spend in order to generate these products.
I did experience a hiccup with the mission planning/control software running on my iPad Mini 2. It turns out that the Terrain Awareness feature in my mission planning/control software requires some extra CPU horsepower — the software overpowered my iPad Mini and crashed once during a mission. The UAV kept flying its intended course as instructed, but it stopped taking photos when the software crashed, so I brought it back to the launch point.
After visiting the software vendor’s website, it became clear to me that it’s probably time to upgrade my iPad Mini to the latest model to keep up with the new features being implemented in the software.
A Quick Note on High-Accuracy GNSS
In March, I attended the Hawaii GIS conference and decided to perform some benchmark testing on a survey mark using WAAS and a high-accuracy GNSS receiver.
My goal was two-fold.
- See how WAAS is behaving in Hawaii. WAAS in Hawaii is an anomaly because it’s far away from the Continental U.S. (CONUS) where all the WAAS reference stations are located (there’s one in Honolulu, but that’s it). In other words, Hawaii is the most challenging place for WAAS accuracy in North America.
- See how many GNSS satellites I could track and use in Hawaii.
Holy moly, was I surprised at how good it was. I’ve tested WAAS in Hawaii several times in the past many years. The last time I tested it was in 2013 and the GNSS receiver I used (GPS + GLONASS) achieved a steady 80-cm accuracy. That was pretty darned good for WAAS in Hawaii at that time.
I packed up some receivers and hiked about 4 miles to a survey mark I could find in Honolulu. I was a great survey mark for testing because it was on the sidewalk of a quiet residential street. Following is a photo of the survey mark.

I set up on the survey mark and then looked at the satellites the receiver was tracking. I wanted to know how many GPS, GLONASS, Galileo and BeiDou satellites were being used. Following is a screen shot.

Twenty-three GNSS satellites being used! Are you kidding me? This is more than double the number of GPS satellites being used. This illustrates the power of four-constellation GNSS that is only going to continue to get better over the next several years.
What surprised me the most was the number of Galileo satellites being used, and this was before two Galileo satellites were declared healthy in late May.
My next test was to evaluate WAAS accuracy. Who cares how many satellites the receiver is using if the accuracy isn’t improved? I plumbed the receiver antenna on the survey mark and plotted ~7 minutes of data.

Yep, that’s about 30-cm accuracy over a 7-minute period. That’s better by a factor of two compared to the accuracy I saw in 2013. Sure, WAAS has improved somewhat, and maybe the ionosphere was particularly happy that day, but I have to believe that the additional GNSS satellites contributed the most to the improvement in accuracy. In the next few months, I’m going to be performing more tests with WAAS and RTK on my GNSS test course near my office. I’ll keep you posted on the results of those tests.
The Esri International User Conference – July 10-14
As usual, I’ll be attending the largest gathering of GIS professionals in the U.S. next month, the Esri International User Conference. 16,000 of our colleagues will descend upon San Diego to share, network and enjoy the spatialness that we have for one another.
If you’re interested, I’m giving a couple of presentations at the Esri UC:
- Tuesday (July 11), 08:30 a.m., Room 28B (subject to change)
Paper Title: An Efficient, Accuracy Mobile GIS Workflow using RTK GNSS
Session Title: Mobile Data Collection
This is cool project I worked on with WaterOne, a large water utility, to design a real-time, high-accuracy GNSS workflow in the Esri environment. They are collecting data at the centimeter level for mapping their above-ground assets as well as new construction using tablet computers and RTK GNSS receivers.
- Thursday (July 13), 8:30 a.m., Room 29C (subject to change)
Paper Title: UAV (drone) applications for water utilities
Session Title: Applied GIS: Three Unique Examples
This is some groundbreaking work I’ve done with American Water on using UAV technology for mapping and inspection. We did a lot of experimenting during the proof-of-concept phase to figure out what applications are practical and which aren’t.
Thanks, and see you next time.
Follow me on Twitter at https://twitter.com/GPSGIS_Eric
All Provided by Eric Gakstatter