Simulation tool verifies GPS/INS integrated systems

In ultra-tight with new simulation tool
A GPS/inertial trajectory data simulation podium can generate simulation data sets for all levels of GPS/INS integration. Here it verifies the operation and performance of a new ultra-tight GPS/INS integrated system, adaptable for both software and conventional hardware receivers.
Navigation systems for land vehicles, embedded in passenger cars, ambulances, police cars, fire trucks and others, provide reasonable accuracy in open-sky environments, but under conditions such as underpasses and tunnels GPS satellite signals cannot be readily tracked since they are not consistently available or have low signal power. One major factor that directly impacts the effectiveness of receivers in terms of complexity and speed is receiver architecture.
Scalar (conventional) signal tracking architectures process each satellite signal individually: pseudoranges and pseudorange rate measurements are produced separately and only combined in the navigation filter to generate the required solution. Hence, no information exchange happens between the different tracking channels.
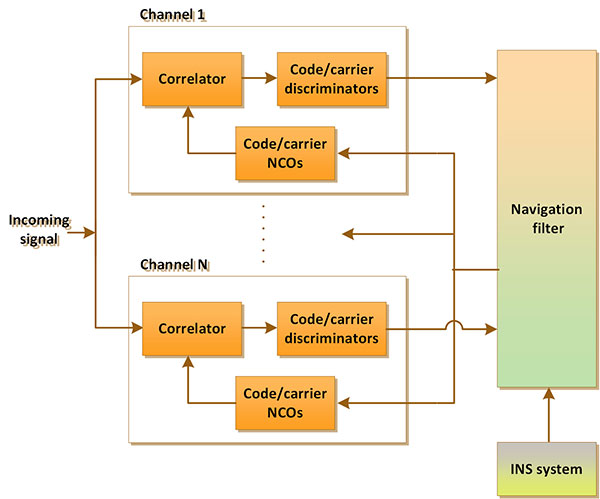
On the contrary, vector tracking systems combine all the channels in one system along with the navigation filter to produce pseudoranges, pseudorange rates and the navigation solution all at the same time. Figure 1 shows the general architecture of a vector tracking system. Vector-tracking architectures have proven themselves able to provide better performance over scalar tracking systems in challenging environments where most satellite signals are received at low signal-to-noise ratios (SNR).
Any information available about the satellite constellation and user position and dynamics can be used to predict the received signals. Therefore, the best estimation we have for the receiver position and dynamics makes the vector tracking loops more robust. One approach to reduce or perhaps remove the receiver dynamic stress in the signal tracking loops is to provide external aiding information.
Several sensor types have been augmented with GPS to improve navigation system accuracy and reliability. The most common systems that have been widely augmented with GPS are inertial sensor systems (INS). Because an INS system can provide a continuous solution at a high data rate, it is virtually a twin to the GPS with respect to its widespread use in navigation applications.
Using the solution obtained from INS, one can estimate a line-of-sight acceleration that can be integrated to obtain a line-of-sight velocity. Car odometers also provide reasonably accurate measurements of the vehicle speed. Incorporating this velocity (from INS or other aiding sources) into tracking-loop computations helps the tracking loop to maintain tracking at a lower bandwidth even when high dynamics are experienced at the receiver. When the aiding source to the GPS signal tracking loops is an INS, the system is known as ultra-tight GPS/INS integration. Figure 2 shows a general block diagram of an ultra-tightly coupled GPS/INS integration system.
The ultra-tight GPS/INS integrated system enhances a GPS receiver’s tracking ability in challenging environments and consequently improves navigation availability.
Loose. The loosely coupled integration mode is easier to implement since the inertial and GPS navigation solutions are generated independently before being weighted together in a separate navigation filter. The advantages of this coupling strategy are that the INS errors are bounded by the GPS updates, the INS can be used to bridge GPS updates, and the GPS can be used to help calibrate the deterministic parts of the inertial errors instantly. The main drawback of this strategy, however, is that it requires at least four satellites in view which cannot always be guaranteed because of signal interruption due to many factors such as signal blockage by trees or tall buildings.
Tight. The tightly coupled integration mode combines both systems into a single navigation filter. The major limitation of visibility of at least four satellites is removed since this integration mode can provide a GPS update even if fewer than four satellites are visible. The tightly coupled architecture also overcomes the problem of correlated measurements that arises due to cascaded Kalman filtering in the loosely coupled approach. However, these advantages come with the penalty of increased system complexity.
Ultra-tight. In the ultra-tightly coupled integration approach, the raw measurements come from one step further towards the front end of a GPS receiver, in the form of I (in-phase) and Q ( quadrature ) signal samples. These I and Q measurements are integrated with the position, velocity and attitude of the INS in a complementary filter. The integration of INS-derived Doppler feedback to the carrier tracking loops provides a vital benefit to this system; the INS Doppler aiding removes the vehicle Doppler from the GPS signal. Hence, it results in a significant reduction in the carrier tracking loop bandwidth. In addition, due to lower bandwidths, the accuracy of the raw measurements is further increased.
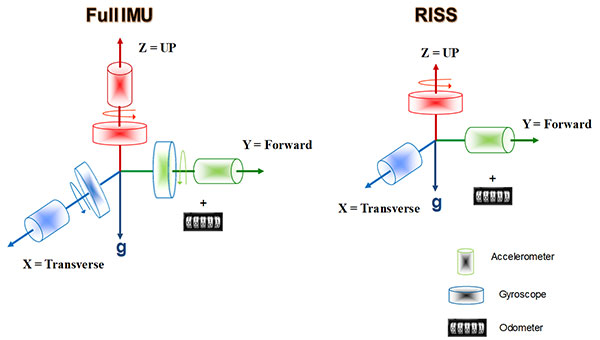
The proposed method uses a variant of the Kalman filter as the core of the navigation processor coupled with the inertial sensor’s input in a reduced inertial sensor system (RISS) configuration and car speed odometer; see Figure 3. Additionally, the data sets used in this work are generated using a newly composed GPS/INS trajectory data simulation platform.
Secondly, it demonstrates a novel GPS/INS trajectory data simulation podium. This combined simulation system can produce simulation data sets for all levels of GPS/INS integration and is used to verify the operation and performance of the ultra-tight GPS/INS integrated system.
SYSTEM ARCHITECTURE AND IMPLEMENTATION
The goal of signal tracking loops is to monitor changes in the main signal parameters, namely, code phase and carrier frequency, to keep the locally generated signal aligned with the received signal. Successful tracking of these variables will provide good estimations of the parameters that are required for the navigation filter to function correctly. Errors in the code phase and carrier frequency are usually represented as:
where ![]() and
and ![]() are the measured and estimated code phases, respectively.
are the measured and estimated code phases, respectively. ![]() and
and ![]() are the measured and estimated carrier Doppler frequencies, respectively. These estimated errors at the signal tracking stage are directly linked to the errors in the states at the navigation filter.
are the measured and estimated carrier Doppler frequencies, respectively. These estimated errors at the signal tracking stage are directly linked to the errors in the states at the navigation filter.
Each tracking channel provides its own measurements based on a discriminator’s output. All the measurements are then processed together in the navigation filter and feedback is provided to each channel based on the obtained navigation solution results. The filter will process the error signals received from the discriminators in the form of code phase error ![]() and frequency error
and frequency error ![]() . Thus, the measurements of the filter will be pseudorange errors and pseudorange rate errors.
. Thus, the measurements of the filter will be pseudorange errors and pseudorange rate errors.
Where fcode is the code frequency = 1.023 x 10⁶ Hz, fcarrier is the nominal L1 frequency = 1575.42 MHz, and η represents the measurement noise vector.
The computations of the navigation solution start with a mechanization process where we first calculate pitch, roll and azimuth angles. Knowing the Azimuth and pitch angles, vehicle forward velocity can be projected into East, North and Up velocities. The East and North velocities are transformed into geodetic coordinates and then integrated over the sample interval to obtain positions in latitude and longitude. The vertical component of velocity is integrated to obtain altitude. At this stage, we run the Kalman navigation filter through its two-step known cycle, prediction and update, incorporating any available measurements to estimate the receivers’ new position and velocity. Then, the estimated pseudoranges and pseudorange rates are calculated. Finally, the computed code and carrier frequencies are fed back to control the code and carrier oscillator inputs to align the locally generated signal with the incoming signal.
COMBINED SIMULATION SYSTEM
In our work, we combined two existing INS and GNSS simulators to build a comprehensive simulation tool that can produce a limitless number of data sets of repeated trajectories under entirely controlled circumstances. Moreover, these data sets can be used for any level of GPS/INS integration system validation. The system is also used to verify the performance of the above proposed ultra-tight GPS/INS integration system architecture.
For the GPS data, a satellite navigation simulation signal generator was used to build and generate the desired trajectory. The selected model has the ability to provide dynamic capacity in Doppler and signal power levels as well as adequate channels to simulate line-of-sight and multipath satellite signals. The unit is driven by a software package that comes in different versions; the most powerful version is used in this research to drive the simulation hardware system to generate the output radio frequency (RF) signal.
A receiver front-end then generates the discretized data stream in the form of in-phase (I) and quadrature-phase (Q) signals. The unit is a rugged dual-frequency L1/L2 front-end intended mainly for software receiver and interference detection systems. The unit is capable of logging L1/L2 data at bandwidths of 2.5 MHz, 5.0 MHz, 10 MHz and 20 MHz with data quantization varying from 1 bit to 8 bits.
For the INS data sets, the INS simulator, developed by the Mobile Multi-sensor Group at the University of Calgary, is used for simulating inertial measurement unit (IMU) raw data. The INS simulator can virtually generate the raw data measurements of any grade of IMUs such as navigation, tactical and consumer-grade systems. A wide number of sensor errors can be simulated using this software such as bias instability, random walk, scale factor, errors due to thermal drift and g-sensitivity and so on. While the simulator can generate raw IMU measurements using user-defined vehicle motion and dynamics, such as static scenarios, straight line, constant velocities, accelerations, turns and bumpy roads, and it can also accept externally injected vehicle dynamics from real trajectory data.
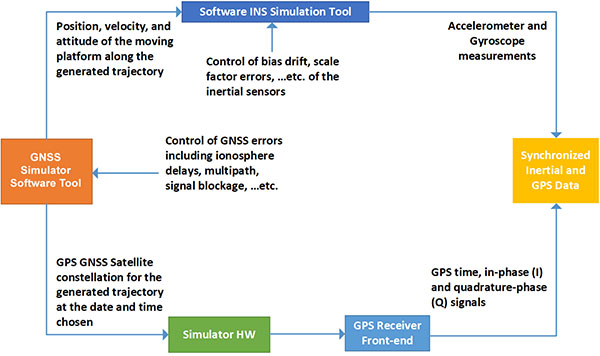
Figure 4 shows a high-level diagram of the trajectory data flow from the two arms of the synthesized simulator. Several conversion code scripts were written to convert raw data into the implementation platform workspace format. Both data sets were then merged through the implemented algorithm to provide the navigation solution.
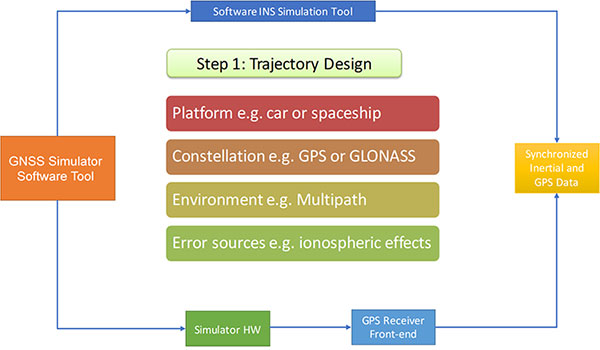
Step 1 of Simulation Process. The trajectory design, Figure 5, outlines the general aspects of the process. Among these are the type of platform to be simulated, for example. land vehicles, ships, aircraft and so on; the satellite constellation, typically GPS, Galileo or GLONASS; the environment, whether rural, suburban or urban; and error sources, including ionospheric and tropospheric effects. All of this is done using the simulator’s software.
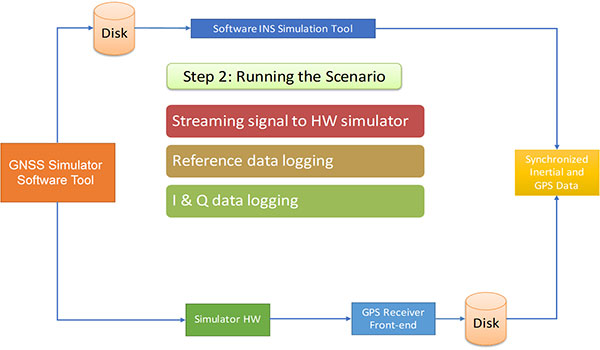
Step 2. This incorporates the implementation of the data stream that is fed into the signal generator hardware, which transforms this into an RF signal (Figure 6). Concurrently, the reference trajectory data is logged on the same computer that hosts the simulation software. The I and Q branches are recorded, simultaneously with the reference trajectory, on a GNSS receiver front-end.
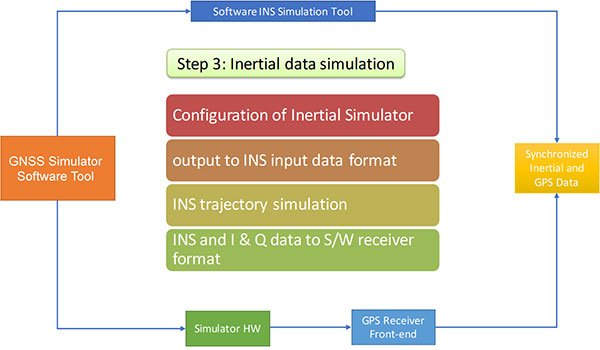
Step 3. Finally, the inertial data is simulated. First, the INS simulator is configured according to the desired simulation parameters. Among these are the sensor data rate, grade (or quality) of the selected sensor(s), and some initialization quantities that are obtained from the output of the GNSS signal simulator. Once the configuration process is complete, data extracted from the reference trajectory is converted into a format appropriate to the INS simulator, and the inertial data simulation is performed. At this stage, data from both the GNSS side and INS side can be converted into a format suitable for use by the integrated INS/GNSS system (see Figure 7).
EXPERIMENTAL WORK
Using the complete simulation system, several simulation data sets are used to verify the performance of the proposed algorithm in semi real-life scenarios. Each time a chosen scenario is run on the Spirent GNSS simulator, the software data is applied to the Spirent hardware to generate the RF signal, which is then applied to the input of the front-end unit to provide the corresponding I and Q signal streams. Meanwhile, the trajectory data is logged from the simulator to be used as a reference and then fed to the INS simulator to generate the corresponding raw IMU data. Finally, the I and Q and raw IMU data are combined (when the ultra-tight solution is used) in a software receiver code to extract the ultimate positioning solution. For scalar and vector-based signal tracking, only GPS data is used. One sample trajectory that simulates a land vehicle driving at low speed is selected to show results of the proposed method.
Table 1 shows initialization of the key parameters during the simulation period. A GPS-only satellite constellation is used. We also limited the maximum number of simulated satellites to seven.
RESULTS
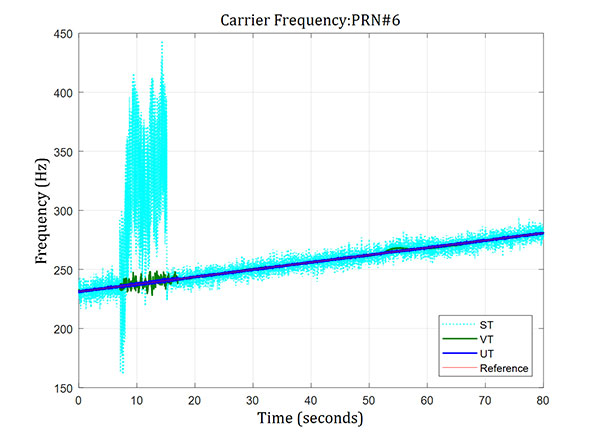
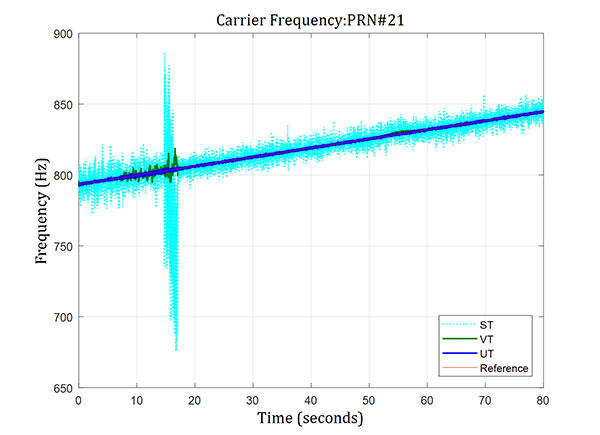
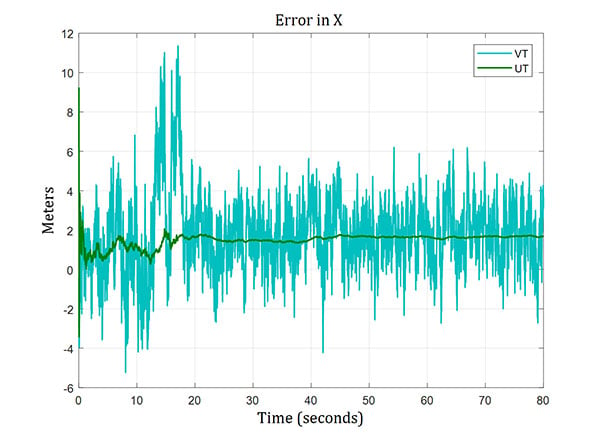
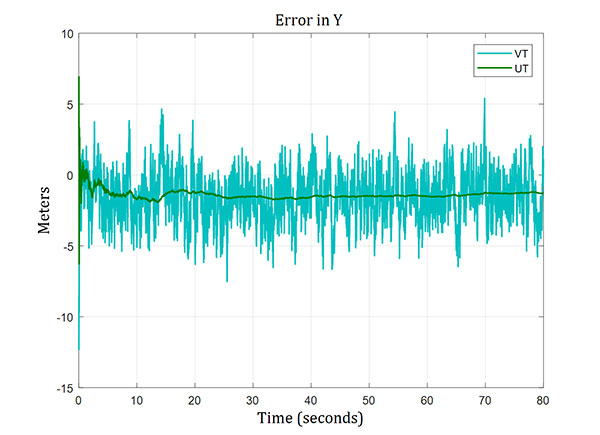
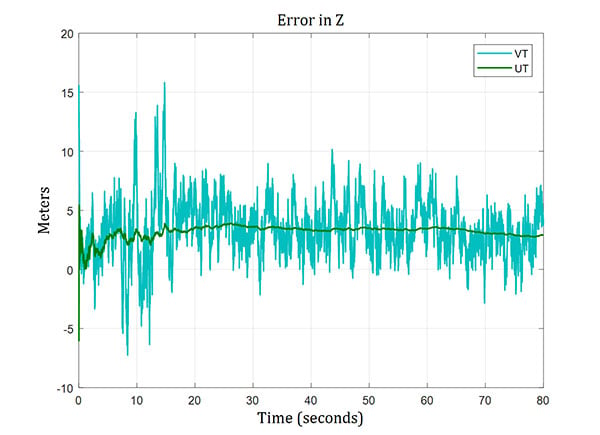
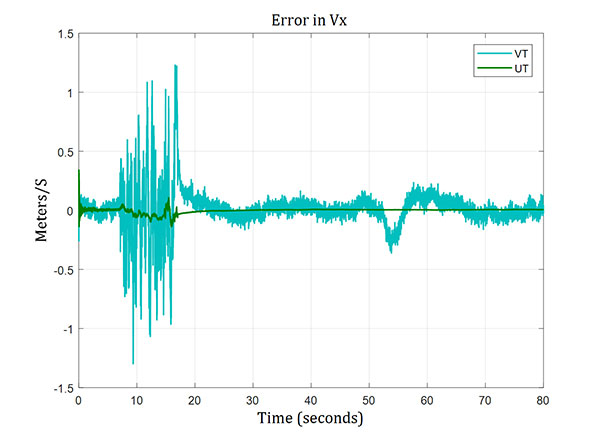
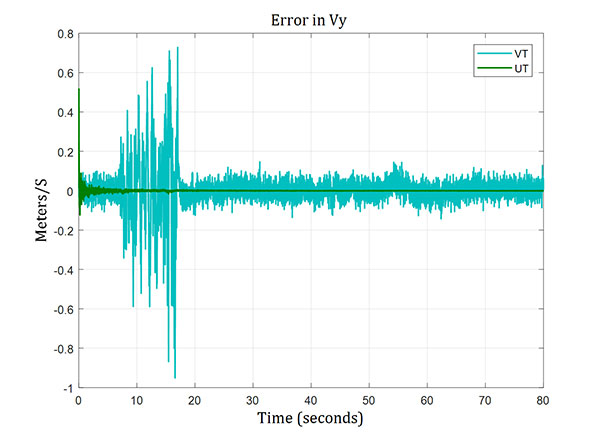
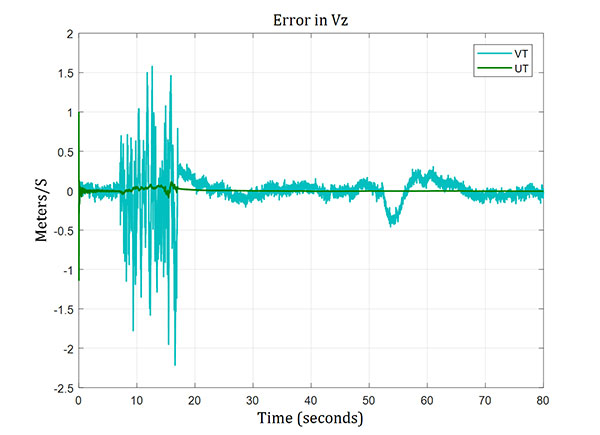
The reference solution used to evaluate the proposed method and combined simulation system is the pure data sets extracted from the Spirent GNSS simulator. The figures below show results of 80 seconds of data processing. At around seven seconds of the period, a 43-dB signal drop was applied for 8 seconds on channel number 1, which is assigned to track PRN number 06. A similar signal drop is partially overlapped with this, but was applied for only 5 seconds on channel number 3, which is dedicated to track PRN number 21. The following abbreviations are used in the figures: ST for scalar tracking, VT for vector tracking, and UT for ultra-tight GPS/INS integration system.
Figure 8 and Figure 9 show the carrier frequency for PRN 06 and PRN 21. Large frequency errors (greater than 100 Hz) are noticeable in the scalar tracking system. The vector tracking system, however, was much less affected, showing more resistance to the drop in signal-to-noise ratio. The ultra-tight GPS/INS integration system was nearly unaffected and maintained a very accurate carrier frequency estimation throughout the simulated trajectory.
The trend of the position errors is plotted in Figures 10, 11 and 12. The maximum position error was around 15 meters in the case of vector tracking, whereas the maximum position error from the ultra-tight system was below 4 meters in the worst case.
Velocity errors are depicted in Figures 13, 14 and 15. Velocity errors for the vector tracking system reached about 2 meters per second during the low signal-to-noise ratio period. However, they were only small fractions of a meter per second for the ultra-tight GPS/INS integration system.
CONCLUSIONS
This article shows the performance of a newly proposed ultra-tight GPS/INS integrated system using an RISS that is intended to enhance GPS receivers’ tracking ability in challenging environments, thus improving navigation availability. Additionally, we present a freshly combined GPS/INS trajectory data simulator that can be used to generate simulation data sets for all levels of GPS/INS integration. The two components of the simulator are demonstrated to be perfectly linked. Performance of the algorithm was tested using several trajectories, and the algorithm demonstrated durability against harsh signal degradation. Acceptable position and velocity errors were achieved. Expected future improvements to the algorithm aim to employ longer integration time, and the performance of different grades of IMUs are to be simulated.
ACKNOWLEDGMENT
This work described in this article was first presented at the ION GNSS+ 2018 conference in Miami, Florida.
MANUFACTURERS
The Spirent GSS6700 Satellite Navigation Simulation Signal Generator was used in these tests, with SimGen software. The NovAtel FireHose front-end generated the discretized data stream.
MALEK KARAIM is a Ph.D. candidate at the Department of Electrical and Computer Engineering, Queen’s University, Canada. He is working within the Navigation and Instrumentation Research (NavINST) Group at Queens’ University/Royal Military College of Canada.
MOHAMED YOUSSEF received his Ph.D. degree from the Department of Geomatics Engineering and the Department of Electrical and Computer Engineering, University of Calgary, Alberta, Canada. He leads GNSS R&D activities at Sony North America.
ABOELMAGD NOURELDIN is a cross-appointment associate professor at the departments of electrical and computer engineering in Queen’s University and the Royal Military College (RMC) of Canada. He is the director of the Navigation and Instrumentation Research Laboratory at RMC.






Follow Us