No audio available for this content.
Using a smartphone for GNSS ionospheric data collection
By Andrew Kennedy, Ryan Kingsbury, Anthea Coster, Victor Pankratius, Philip. J. Erickson, Paulo Roberto Fagundes, Eurico R. de Paula, Kerri Cahoy and Juha Vierinen

DO YOU REMEMBER YOUR FIRST PERSONAL COMPUTER? I do.
It was a Timex Sinclair 1000. Released in 1982, it used a Zilog Z80A processor running at 3.25 MHz and sported a whopping two kilobytes of memory and a wonky membrane keyboard. You had to hook it up to a tape recorder to record and load programs (in BASIC) and it used a TV tuned to channel 3 or 4 as a display device. We’ve certainly come a long way in the past almost 35 years. Now, I have a computer I can hold in my hand with more than one thousand times the computing power and more than one million times the memory and a built-in interactive display. It’s an Apple iPhone 5S smartphone. I am one of the billions of owners of a smartphone. In 2015 alone, almost 1.5 billion smartphones were sold worldwide.
We use our smartphones for a wide range of tasks. Besides voice phone calls, we use them to text, to wake us up, to listen to our tunes, to watch movies, to take photographs and videos, to surf the Web, to navigate. The list goes on and on. In 2015, there were about 1.5 million applications or apps available for both Apple and Android smartphones. Those with the ability can even program their smartphones to perform tasks specific to their lifestyles, hobbies, or professions.
In this month’s column, we take a look at the use of a smartphone app to collect GNSS ionospheric data. Why would you want to do that?
In the experience of the developers of the app, GNSS receivers are often characterized by a complex, proprietary data interface that differs for each manufacturer. In practice, this leads to significant investments in understanding interfaces and software tools. Human operators must familiarize themselves with the commands used to configure each receiver as well as with proprietary graphical user interfaces and tools specific to each receiver. The authors’ app-centric approach provides a software framework and output format that remain the same for different receivers. Receiver-specific commands are configurable within the app, so users can easily attach new receivers while reusing the existing infrastructures for data collection and processing. And smartphones have more than enough power and connectivity to do the job and can be easily moved from site to site.
The smartphone as a handheld device to help scientists study the ionosphere? Probably not even Clive Sinclair foresaw that.
Continuous and high-resolution dual-frequency GNSS observations are required to capture the ionospheric response to external forcing from events such as the 2011 Tohoku-Oki earthquake and tsunami or the 2003 Halloween geomagnetic storms that severely impacted the U.S. Federal Aviation Administration’s Wide Area Augmentation System. These events, as well as other natural and man-made disasters, have been shown to produce structure of various scales in the ionospheric total electron content (TEC). TEC estimates can be directly derived from dual-frequency GNSS observations and so these observations are a valuable source of information about the ionosphere.
However, with the exception of a few areas such as Japan, where the GNSS Earth Observation Network (GEONET) has an average spacing of 5 kilometers, the density of ground-based GNSS sensors needed to capture displacements of the ionosphere is lacking. This is primarily due to data acquisition costs. Networks on the order of 50-kilometer spacing would provide the density of coverage needed to capture the propagation of medium-scale traveling ionospheric disturbances (TIDs), which have horizontal wavelengths of up to hundreds of kilometers and speeds of hundreds of meters per second. Irregularity structures in the polar regions may require even denser networks to capture the fine-grained auroral structures.
The Mahali project, supported by the U.S. National Science Foundation, aims to improve the ability of the GNSS community to perform large-scale science by facilitating increases in the density of required sensors. The “last mile data transport” problem remains critical, and Mahali explores new ways to efficiently and effectively move data from the many types of GNSS receivers deployed across the world to the cloud, at affordable cost. “Kila Mahali” means “everywhere” in the Swahili language, a term that epitomizes the project’s ambitions for data collection.
A short-term objective of Mahali is to demonstrate the utility of mobile phones as low-cost preprocessors and relays that transport TEC observation data to cloud-computing environments for more advanced processing and storage. We eventually envision an “ecosystem” of open-source software, which includes various smartphone tools that aid researchers in interfacing with GNSS sensors.
In this article, we present one such smartphone software application (hereafter denoted “app”) from the Mahali software ecosystem that researchers can install on their Android smartphones. They can then link the smartphone directly to a dual-frequency GNSS receiver over a USB port. Thus, data can be immediately collected, pre-processed on the smartphone, and sent to cloud storage environments like Dropbox whenever an Internet connection is available. This approach tests out a building block for large-scale data-collection networks, which can grow incrementally by adding more GNSS receivers and smartphones.
Smartphones for science
Modern mobile processors offer ever-increasing computing capabilities. For example, Nvidia offers mobile multicore processors with four central-processing-unit cores and more than 60 graphics-processing-unit cores on a single chip.
While most mobile applications are leveraging this power for multimedia, photography or gaming, these hardware capabilities are now available for scientific data processing. Everyday smartphones like the Samsung Galaxy S5 smartphone have a quad-core processor running at 2.5 GHz, 2 GB of random-access memory, and a variety of sensor and network connectivity options.
The smartphone also features reliable backhaul via Wi-Fi and the world’s ever-growing cellular data network, qualities highly relevant for scientific applications. Even in Africa, there was an average of 60 mobile-cellular subscriptions per 100 inhabitants in 2012 according to the International Telecommunication Union. Smartphones therefore have a significant advantage over other platforms for large-scale, distributed applications.
Today’s smartphones are typically only equipped with single-frequency GNSS receivers, and thus it is not yet possible to entirely replace dual-frequency GNSS receivers by smartphones running a data-collection app. To make the necessary scientific measurements to recover TEC, receivers require dual-frequency tracking capability. In the current work, we focus primarily on using smartphones as data-collection and relay devices. We anticipate, however, that future consumer demands, such as precision navigation, will eventually push dual-frequency capabilities into next-generation mobile devices. In that case, our app would not need to be connected to external receivers, but instead would use the smartphone’s internal receiver.
Mahali GNSS Logger App
This section describes the Mahali GNSS Logger App we developed at the Massachusetts Institute of Technology (MIT) to collect data from a GNSS receiver and relay scientific data to the cloud.
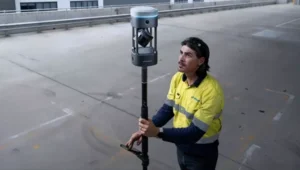
Setup. The app interfaces with a GNSS receiver over a USB-to-serial connector, as shown in FIGURES 1 and 2. It collects observation data output from the receiver, and stores it to files on local storage on the smartphone. The app allows the uplink of data files to a cloud-based storage medium available through the Internet, where further data processing and analysis can be performed. For our evaluation, we demonstrate this uplink by interfacing with Dropbox, a widely used cloud data storage service.


The GNSS data logger app facilitates the process of collecting GNSS data from a variety of commercially available receivers. The app was developed in the Java/Android programming language for deployment on mobile devices running Google’s Android operating system (OS).
Usage scenarios. Figure 3 illustrates the concept of operations for a scenario involving multiple smartphones and GNSS receivers. Data is initially generated by each GNSS receiver (step 1). A smartphone connected to each receiver runs the app (step 2) and gathers the data on local storage. After establishing a connection to a cloud-based server, the app acts as a relay and transmits the local data to the cloud (step 3).

The app is intended for usage scenarios in which a particular smartphone connects to a single GNSS receiver. The app collects the data from the serial output of the receiver and forwards that data to a cloud-based storage location for subsequent analysis. We focused primarily on Dropbox for this purpose, used through Android’s “share” interface. In addition, the app can also configure the GNSS receiver by issuing specific commands on the serial port.
User interface. The app was structured to provide a convenient user interface for the quick commencement of data-collection sessions and upload of data files to the cloud. FIGURE 4 illustrates the typical user interface that a scientist would see when starting the app, and FIGURE 5 shows how scientists can configure commands that the smartphone issues to initialize a GNSS device.


The “Edit GPS Config” button (item 1 in Figure 4) allows access to a basic text editor screen (shown in Figure 5), which lists a series of ASCII character commands that are sent to the GNSS receiver upon commencement of a data-collection session. This approach lets a user configure the app to work with different types of GNSS receivers.
The “Session control” toggle button (item 2 in Figure 4) allows the user to start and stop a data-collection session. When a session is created, it is assigned a file name using a UTC time tag from the smartphone’s clock and a file extension corresponding to the GNSS receiver type. The file is stored in a dedicated directory in the smartphone’s external bulk memory (such as an SD card). This directory location is defined within the app at a set location.
The real-time status display (item 3 in Figure 4) shows the name of the current session file and the number of bytes that have been collected from the receiver interface and saved to the file.
The scrollable “Previous Sessions” display (item 4 in Figure 4) lists all previous session files found in the external storage directory. The user can tap on any session within the list to upload the file to the cloud. The user can delete session files from a submenu accessible through the three dots at the top of the screen.
File formats. The app currently logs data in a binary format that is dependent on the particular GNSS receiver. An example is the “nvd” format shown in Figure 4. Once the data is in the cloud, a variety of software tools are available to convert these files to other formats, such as the widely used RINEX format.
Currently, our post-processing of “nvd” files stored in the cloud is done in a custom Python script that converts them to the RINEX format in batch mode. To validate the generated RINEX format, we use the “TEQC” tool provided by UNAVCO.
Software architecture. The Android OS implements “threads” as a way to let users run multiple tasks at the same time, to manage multiple user interface updates, or to perform various background actions. “Activity” threads handle a user’s interaction with the main screen and GNSS configuration screens. Other app-specific threads are spawned by the main activity thread in response to user prompts. The spawned threads perform specific actions asynchronously in the background, so the user can continue to interact with the app while uploads are in progress.
In particular, the main activity thread handles the user’s interaction with the main screen. The activity calls the appropriate software functions that respond to button taps. The main thread also updates the user interface with the latest status information and manages the creation of new threads for serial input/output (I/O) as well as uploads to Dropbox.
The GNSS receiver config activity thread presents the user with a light-weight text editor, which captures all necessary GNSS receiver configuration commands. In the current version of the app, these commands are permanently stored in the smartphone internal bulk memory using the Android SharedPreferences module. This can be easily extended in the future, such as to store and download command configuration files to and from the cloud.
When a user toggles the “Session Control” button (in other words, a “Start Session” event), the serial I/O manager thread starts storing all the bytes received from a GNSS receiver to a GNSS session file. The bytes are read from the smartphone’s USB serial data interface and written to a file in binary format. The file and its properties are represented internally by a “GNSS Session” object. The file itself is a raw byte file; it is formatted in exactly the same way that the GNSS receiver outputs data. When interfacing with one modern multi-GNSS receiver specifically designed for scintillation studies and TEC monitoring, every hour of data collected took about 18 MB of storage. We have not yet tested the app’s performance at extremely high data output rates from a GNSS receiver, but we expect that it should be able to support all standard serial data rates.
When a user stops the data collection, the main activity updates the “Previous Sessions” list with a new session. The code ensures that at most one serial I/O manager thread is created, that is, a GNSS receiver data stream can only be logged to one session file at a time.
A DB (Dropbox) upload task is created upon user prompt. The task sends the selected session file to a directory within a Dropbox account specified by the user. The first time a user attempts file upload, the app obtains the necessary account authorization from the user.
Testing in the field
To test the app and the Mahali system concept, field trials were conducted from January to February 2015 in Brazil at the sites shown in TABLE 1. Data were collected from one multi-GNSS scintillation receiver, and two older GPS scintillation receivers, using two types of Android smartphones.

We chose Brazil for our test because it is in a region of significant interest for space weather studies. Manaus, one of the sites visited, is located at the magnetic dip latitude 5.1° N. São José dos Campos, the other site visited, is located south of the geomagnetic equator at a dip latitude of 18.9° S and is within the equatorial, or Appleton, anomaly region. This anomaly region, consisting of enhanced TEC, forms 10 to 20 degrees north and south of the geomagnetic equator due to the well-known “ionization fountain” effect. During geomagnetic storms, electric fields of magnetospheric origin can penetrate into the equatorial region and directly influence ionospheric density, neutral composition and temperature at low latitudes.
Geomagnetic storms generate large-scale gravity waves that propagate from high to low latitudes. Because of Brazil’s location in the tropics, gravity waves associated with tropospheric convection patterns can also propagate upwards producing a myriad of small- to medium-scale TIDs. Finally, it is suspected that the South Atlantic Anomaly, a region of weakened geomagnetic field that falls over Brazil, exerts considerable influence on the development of space weather phenomena in both hemispheres. Large day-to-night and day-to-day variations in TEC are frequently observed in this region. For all of these reasons, having a dense pattern of GNSS observations from this region is of significant scientific interest.
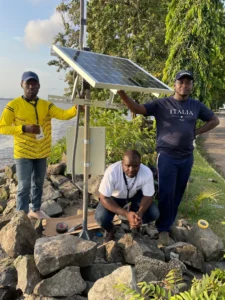
Our test campaign was primarily motivated by a desire to test the utility of the smartphone-based solution and to demonstrate the feasibility of easily setting up remote field sites for the purpose of filling in gaps in data coverage. During this campaign, we collected data at the three sites listed in Table 1 using three different receivers. About 220 MB of data were collected in total at all of the sites.
Table 1 summarizes the relevant information about the field test sites. The first field site visited was the Universidade Luterana do Brasil (ULBRA) campus in Manaus on Jan. 30, 2015. This site is in close proximity to the geomagnetic equator. Because the receiver at the ULBRA campus is involved in ongoing scientific observations, we were only able to collect data for a short period of time, approximately an hour in total. Nevertheless, we were able to attach the smartphone, configure the GNSS receiver to produce the appropriate data products and start data collection all within about 10 minutes. In total, only 20 minutes of GPS data were collected at this location, but the experience demonstrated how quickly the app-based solution can be installed.
The second and third field sites visited were near São José dos Campos on the campuses of the Instituto Nacional de Pesquisas Espaciais (INPE) and Universidade do Vale do Paraíba (UNIVAP). São José dos Campos is well to the south of the geomagnetic equator and in the Appleton anomaly region. We successfully collected observations from both sites, but were only able to conduct long-duration testing at the UNIVAP site (approximately 9.5 hours in total). This data is shown in FIGURE 6, in total electron content units (TECu = 1016 electrons per square meter) in the bottom plot (with the four-letter site name SAUN).

The other data in Figure 6 (site names MCL1, RJCG, ONRJ) were processed from GPS receivers operated by Instituto Brasileiro de Geografia e Estatística (IBGE). These observations show a progression of TEC values as a function of latitude and were collected on Feb. 5, 2015, a day of minor geomagnetic activity (the highest value reached of the Kp index, an indication of global geomagnetic activity, was 3.3) and of moderate solar flux (10.7-centimeter solar flux, an indicator of solar activity, was 142). The data collected at UNIVAP covers the period from 10:00 until 20:00 UTC. Note that for the earlier, more geophysically active period shown in Figure 6 between 0:00 and 5:00 UTC, the smartphone did not collect data due to resource limitations on available battery power.

FIGURE 7 illustrates the overall geophysical picture. It shows the locations of the data-collection sites overlaid onto vertical TEC estimates obtained separately from the aforementioned Brazilian GNSS receiver network and receivers owned and operated by the Red Argentina de Monitoreo Satelital Continuo (RAMSAC) continuously operating reference station network of the Instituto Geográfico Nacional de la República Argentina and the Low Latitude Ionospheric Sensor Network. This data was averaged over 15 minutes and binned in 1° by 1° bins. The southern Appleton anomaly region clearly appears as a red band that extends diagonally north of São José dos Campos parallel to the geomagnetic equator that dips in this region. Because this day is geomagnetically quiet, São José dos Campos lies in a region of smaller TEC south of the anomaly region. During more geomagnetically active conditions, it can lie directly under the anomaly.

By contrast, FIGURE 8 shows data that is neither binned nor averaged over time. This alternate processing method using the same underlying data set reveals TIDs moving across the region. The low concentration of electrons in the region 40°–55° W longitude and 5°–10° S latitude and the high concentration of electrons in the region 40°–55° W longitude and 15°–20° S latitude suggest the shape of a TID. Relevant to the potentials of distributed Mahali sensor systems, better interpretations could be made in this scientific context with more data points.
Both Figures 7 and 8 clearly show the need for more receiver sites to fill in the gaps in data coverage. This is where the Mahali concept can make a real contribution, as it enables receiver deployment in areas with less developed infrastructure such as the Amazon area.
We have also recently undertaken a campaign in Alaska and have reported on that experience elsewhere (see Further Reading).
Conclusion
This article presents one app in the Mahali software ecosystem, designed to directly connect smartphones to GNSS receivers for scientific data collection. The initial Brazil field tests described here have provided a proof of concept that smartphones can be used as versatile relays of data to cloud storage environments. The results have demonstrated that the Mahali concept can make a new and fundamental contribution to observational science by enabling receiver deployment in areas with less developed infrastructure. Observations from these regions contain crucial geophysical information and are at the forefront of geospace scientific research.
We released the source code of our app on GitHub.com under the MIT license. Released files of the Mahali project are available at https://github.com/mahali-dev/mahali.
Acknowledgments
The Mahali project is funded by a National Science Foundation Integrated NSF Support Promoting Interdisciplinary Research (INSPIRE) grant. We would also like to acknowledge our collaborators at Boston College, Virginia Tech, Johns Hopkins University, the University of New Brunswick and Colorado State University, as well as the support of UNAVCO for loans of dual-frequency GNSS receivers for use in this project. We also thank Intel for loans of mobile smartphones.
Travel to Brazil was kindly supported by the MIT International Science and Technology Initiatives program. This article is based on the paper “A Smartphone App for GNSS Ionospheric Data Collection: Initial Field Test Results” presented at ION GNSS+ 2015, the 28th International Technical Meeting of the Satellite Division of The Institute of Navigation held in Tampa, Florida, Sept. 14–18, 2015.
Manufacturers
The GNSS receivers used for our tests in Brazil included a NovAtel GPStation-6 GNSS Ionospheric Scintillation and TEC Monitor (GISTM) receiver and earlier generation NovAtel GSV4004B GISTM receivers. We employed Samsung Galaxy S3 and Motorola Moto G smartphones.
ANDREW KENNEDY is a doctoral candidate in the Space, Telecommunications, Astronomy and Radiation Laboratory at the Massachusetts Institute of Technology (MIT) in Cambridge, Mass.
RYAN KINGSBURY is a recent doctoral graduate from the Space, Telecommunications, Astronomy and Radiation Laboratory at MIT.
ANTHEA COSTER is an assistant director and principal research scientist at MIT Haystack Observatory, Westford, Mass., and a co-principal investigator (co-PI) of the Mahali project.
VICTOR PANKRATIUS is a research scientist at MIT Haystack Observatory where he leads the Astro- & Geo-Informatics Group. He also serves as the principal investigator of the Mahali project.
PHILIP ERIKSON is an assistant director and principal research scientist at MIT Haystack Observatory and a co-PI of the Mahali project.
PAULO ROBERTO FAGUNDES is professor at Universidade do Vale do Paraíba, São José dos Campos, Brazil.
EURICO R. de PAULA is a senior researcher in the Aeronomy Division of the Instituto Nacional de Pesquisas Espaciais, São José dos Campos, Brazil.
KERRI CAHOY is the Boeing Assistant Professor of Aeronautics and Astronautics at MIT.
JUHA VIERINEN is a research scientist at MIT Haystack Observatory.
FURTHER READING
- Authors’ Conference Papers
“The Mahali Project: Deployment Experiences from a Field Campaign in Alaska” by A. Coster, V. Pankratius, T. Morin, W. Rogers, F. Lind, P. Erickson, D. Mascharka, D. Hampton and J. Semeter in Proceedings of ITM 2016, the 2016 International Technical Meeting of The Institute of Navigation, Monterey, Calif., Jan. 25–28, 2016, pp. 885–892.
“A Smartphone App for GNSS Ionospheric Data Collection: Initial Field Test Results” by A. Kennedy, R. Kingsbury, A. Coster, V. Pankratius, P.J. Erickson, P. Fagundes, E.R. de Paula, K. Cahoy and J. Vierinen in Proceedings of ION GNSS+ 2015, the 28th International Technical Meeting of the Satellite Division of The Institute of Navigation, Tampa, Fla., Sept. 14–18, 2015, pp. 3745–3754.
“The Mahali Space Weather Project: Advancing GNSS Ionospheric Science” by A. Coster, V. Pankratius, F. Lind, P. Erickson and J. Semeter in Proceedings of ION GNSS+ 2014, the 27th International Technical Meeting of the Satellite Division of The Institute of Navigation, Tampa, Fla., Sept. 8–12, 2014, pp. 1213–1221.
- Crowd Sourcing and the Internet of Things
Measuring the Information Society Report, International Telecommunication Union, Geneva, Switzerland, 2015.
“Mobile Crowd Sensing in Space Weather Monitoring: The Mahali Project” by V. Pankratius, F. Lind, A. Coster, P. Erickson and J. Semeter in IEEE Communications Magazine, Vo. 52, No. 8, Aug. 2014, pp. 22–28, doi: 10.1109/MCOM.2014.6871665.
- GNSS and Space Weather
“GNSS and the Ionosphere: What’s in Store for the Next Solar Maximum?” by A.B.O. Jensen and C. Mitchell in GPS World, Vol. 22, No. 2, Feb. 2011, pp. 40–48.
“A Beginner’s Guide to Space Weather and GPS” by P.M. Kintner, Jr., October 31, 2006.
“Automated GPS Processing for Global Total Electron Content Data” by W. Rideout and A. Coster in GPS Solutions, Vol. 10, No. 3, July 2006, pp. 219–228, doi: 10.1007/s10291-006-0029-5.
“Space Weather: Monitoring the Ionosphere with GPS” by A. Coster, J. Foster, and P. Erickson in GPS World, Vol. 14, No. 5, May 2003, pp. 42–49.
- Traveling Ionospheric Disturbances
“Medium-scale Traveling Ionospheric Disturbances Observed by GPS Receiver Network in Japan: A Short Review” by T. Tsugawa, N. Kotake, Y. Otsuka and A. Saito in GPS Solutions, Vol. 11, No. 2, March 2007, pp. 139–144, doi: 10.1007/s10291-006- 0045-5.
“Traveling Ionospheric Disturbances as a Diagnostic Tool for Thermospheric Dynamics” by K.C. Yeh in Journal of Geophysics, Vol. 77, No. 4, Feb. 1972, pp. 709–719, doi: 10.1029/JA077i004p00709.
- Ionospheric Scintillations
“Scintillating Statistics: A Look at High-Latitude and Equatorial Ionospheric Disturbances of GPS Signals” by Y. Jiao, Y. (J.) Morton, S. Taylor and W. Pelgrum in GPS World, Vol. 25, No. 10, Oct. 2014, pp. 56–62.
“Ionospheric Scintillations: How Irregularities in Electron Density Perturb Satellite Navigation Systems” by the Satellite-Based Augmentation Systems Ionospheric Working Group in GPS World, Vol. 23, No. 4, April 2012, pp. 44–50.
- Ionospheric Perturbations Due to Natural Hazards
“Recent Developments in Understanding Natural-Hazards-Generated TEC Perturbations: Measurements and Modeling Results” by A. Komjathy, Y.-M. Yang, X. Meng, O. Verkhoglyadova, A. Mannucci and R. Langley in Proceedings of IES2015, the 14th Ionospheric Effects Symposium, Alexandria, Va., May 12–14, 2015.
“Detecting Ionospheric TEC Perturbations Caused by Natural Hazards Using a Global Network of GPS Receivers: The Tohoku Case Study by A. Komjathy, D.A. Galvan, P. Stephens, M.D. Butala, V. Akopian, B. Wilson, O. Verkhoglyadova, A.J. Mannucci and M. Hickey in Earth, Planets and Space, Vol. 64, No. 12, Dec. 2012, pp. 1287–1294.


GPS World staff
When I said in Insights: “… and it used a TV tuned to channel 3 or 4 as a display device”, I misremembered. While external TV RF modulators in North America typically had switchable outputs for channels 3 and 4, the modulator built into the Timex Sinclair 1000 was switchable between channels 2 and 3. By the way, I still have my T/S 1000. I should dust it off one of these days to see if it still works.
— Richard B. Langley.