No audio available for this content.
“Crime is common. Logic is rare. Therefore, it is upon the logic rather than upon the crime that you should dwell.”
“Data! Data! Data!” He cried impatiently. “I can’t make bricks without clay.”
— Sherlock Holmes, “The Adventure of the Copper Beeches,” Sir Arthur Conan Doyle
Watson is to Holmes what information is to intelligence. Watson could listen to the client story, observe the situation, and recite to Holmes all the relevant facts, but he lacked the ability to string together the seemingly random pieces of information into a coherent chain of events leading to the correct hypothesis. A computer can become a Watson, but it takes a human to be Sherlock; however, a human misguided by cognitive biases will end up as Inspector Lestrade, always coming to the wrong conclusion.
When it comes to data, the analogy of drinking from a fire hose is an understatement. Consider that a digital image can be terabytes in size and every day millions of images are taken. Facebook generates 4 petabytes of data daily, and each day there are 500 million tweets and 306 billion emails. Additionally, there are 20 billion connected devices. Combined, the world creates 2.5 quintillion bytes of data every day. If a grain of sand represents a byte of data, then every three days more data is created than there are grains of sand on the Earth, and it is only increasing.
Somewhere in all that data are signals. Real-time threat intelligence systems are looking for those signals before the next huge event occurs. It is a high-stakes hunt for Leviathan, except that Leviathan is only a packet of sand traveling at lightspeed through a cloud obscured by dust.

Interpreting a Signal
The massive volume, variety and velocity of continuously flowing data far surpasses the ability of humans to process. It exceeds the bandwidth most systems can handle. And it quickly overwhelms the capacity to store, manage and act on the information in a timely and cost-effective manner. Resources are not infinite. The best model to handle an overwhelming amount of data is the human brain. Humans are biological sensors. Every moment of every second of our lives, our bodies are receiving an endless stream of stimuli from internal and external sources. Most of this stimuli registers at an unconscious level, and as long as the stimuli is normal and expected, it goes unnoticed by the conscious mind. If, however, any discomfort is experienced, the conscious mind is notified. Then that becomes the focus until normalized. Externally, the same applies to computer data systems. Normal conditions are ignored, but if there is something unusual, such as a loud constant noise, or a colder than normal temperature, it draws all the processing attention.
In the realm of intelligence that is basically how things function. Algorithms are written to learn the normal patterns of life and to identify specific events, words, names, etc. As long as data is within normal parameters, it gets little attention, but as soon as an anomaly exceeds a threshold or something triggers the algorithm, it will immediately be brought to the attention of the intel center. An example can be viewed on the Global Incident Map dashboard. I encourage you to sign up for a free 72-hour membership. If you want to see what real news looks like, this would be a sampling. The number of real incidents that happen across the country and around the world that you never hear about, many of them hair-raising and all of them open source, add to the few stories the media has been able to tell about cyber attacks. Scroll down the page. There are many filters, but I recommend turning them all off to see the full extent of information. Clicking on an incident will drill down into the actual source so you can read about it more thoroughly.
Below is the U.S. Army’s real-time critical incident dashboard called the Joint Analytic Real-Time Virtual Information Sharing System (JARVISS). It tracks and monitors activity near U.S. Army installations and standalone assets of interest around the world.
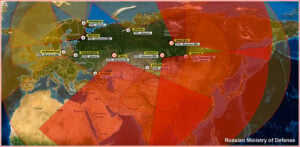
Another dashboard for cyberattacks is Check Point, which shows just how aggressive cyberthreats are throughout world. Here, you can see the patterns of coordinated attacks. A war is underway. The soldiers are cyberwarriors. No country is safe. View the Live Cyber Threat Map.

Fast Analysis in Real Time
Monitoring this information, analysts look for connections. If a plane veers off its flight path, the local operations center is notified. An automatic query shows if any critical-infrastructure assets or other important structures and facilities are in the area. The analyst can immediately find out the type of aircraft, the call sign, who the plane is registered to and who filed the flight plan. Weather radar can be overlaid to see if that is a possible reason for the deviation. Incident reports can be displayed in real time within the area of interest, along with social media feeds and other sources of communication. Traffic patterns can be displayed.
The important question that needs to be answered is whether this is a potential threat. Is there a connection to anything going on anywhere else? A dossier is developed on the person who filed the flight plan, the one who is assumed to be the pilot and the person or organization to which the plane is registered. All of this is being done in a matter of minutes, while the airplane either returns to its flight path or continues its diversion. The air traffic control tower is contacted to share information on the aircraft and its deviation. If the tower does not have an answer, it will radio the pilot for an answer. The passenger and crew manifest also are analyzed. All the data that can be pulled together — including the remaining fuel burn and the aircraft performance limitations — are analyzed.
Patterns emerge from the data. These patterns lead backwards to a cause and forward toward the end result. Finding those clues in the data requires a team of specialists from six primary intelligence disciplines.
- An imagery intelligence analyst brings in the live-streams and remote sensing.
- A human intelligence analyst seeks motivating factors and ways to deescalate the situation.
- A measurements and signatures intelligence specialist defines the operating limitations and the mechanics and science particular to the scenario.
- An open-source intelligence analyst accesses and queries open-source data sets to provide clues.
- A signals intelligence specialist focuses on the communications and electronic signatures.
- A geospatial intelligence analyst brings it all together and provides spatial context through the map the team uses that shows the events unfold in real time.
These analysts and sometimes many others will collect all these pieces of information and turn them into intelligence that decision-makers can use to take action. That is the purpose of intelligence; as CIA veteran Richard Heuer stated, “Intelligence seeks to illuminate the unknown.”
Fortunately, most alerts turn out to be false positives, but every one of them is treated as if it were “the one.” These false positives turn out to be excellent, real-world exercises that hone the skills of the team and wire the brain for speed. These events can last mere minutes or several hours. It’s an adrenaline rush.
To explore live streaming data feeds, Esri has a growing volume of data in its ArcGIS Living Atlas.
“My mind rebels at stagnation. Give me problems, give me work, give me the most abstruse cryptogram, or the most intricate analysis, and I am in my own proper atmosphere…”
— Sherlock Holmes, “The Sign of the Four,” Sir Arthur Conan Doyle
William Tewelow works for the Federal Aviation Administration. He is a graduate of a management fellowship program. While on special assignment to the U.S. Department of Transportation William led the project to crowdsource the National Address Database for the White House Open Data Partnership. He is a Geographic Information Systems Professional (GISP) and a Maryland Scholar STEMnet Speaker. He has a degree in Geographic Information Technology and Intelligence Studies from American Military University and is currently earning a degree in Organizational Leadership. William retired from the U.S. Navy after serving 23 years as a Geospatial and Imagery Intelligence Specialist, a Naval Aviator, a Meteorologist, and a Tactical Oceanographer. He was among the first in the nation to earn a Geospatial Specialist Certification from the U.S. Department of Labor while working at NASA Stennis Space Center in Mississippi. He is married, enjoys traveling, solving problems, playing with data, and fascinated by new technology and historical context. His favorite quote is, “A man’s mind changed by a new idea can never go back to its original dimension.” ~ Oliver Wendell Holmes