No audio available for this content.
On Nov. 9, the National Geodetic Survey (NGS) announced the release of a new Beta NGS Map. This web application allows users to view multiple datasets that are useful to anyone planning or performing a survey project, or anyone that’s just looking for NGS marks.
The map enables users to access NGS datasheets, OPUS Shared Solutions, and the NOAA CORS Network. It also provides a measuring tool, multiple basemaps, and the ability to export data.
I recently used this tool on my iPhone to locate marks when I was traveling. It’s an amazing tool that is easy to navigate, and a useful tool for identifying marks to be included in a project.
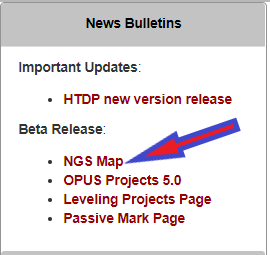
The NGS homepage provides a link to the Beta NGS Map (see below).
When you first click on the NGS Map link a short narrative appears that provides a brief set of instructions on how to use the map (see below). There’s a box that you can check so that the narrative will not appear every time you access the site. It’s important to note that the data for the CORS and OPUS Shared results are updated monthly. This could be an issue in some instances, therefore users should always check the NGS website for the latest information for the NOAA CORS Network or OPUS Shared map.

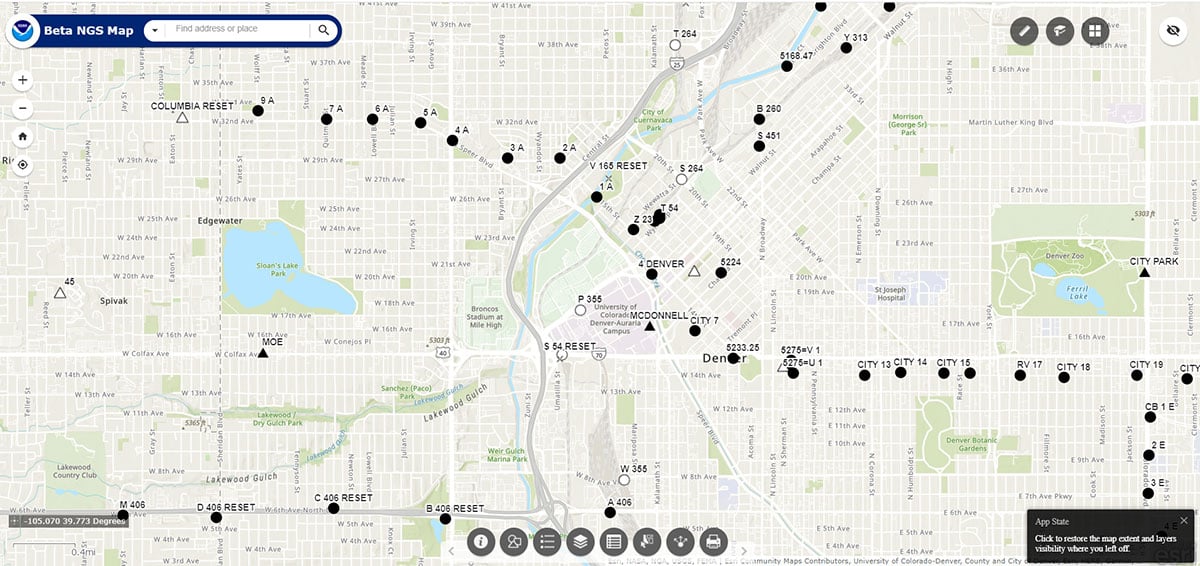
After you click OK at the bottom right of the page, a sample map will appear.
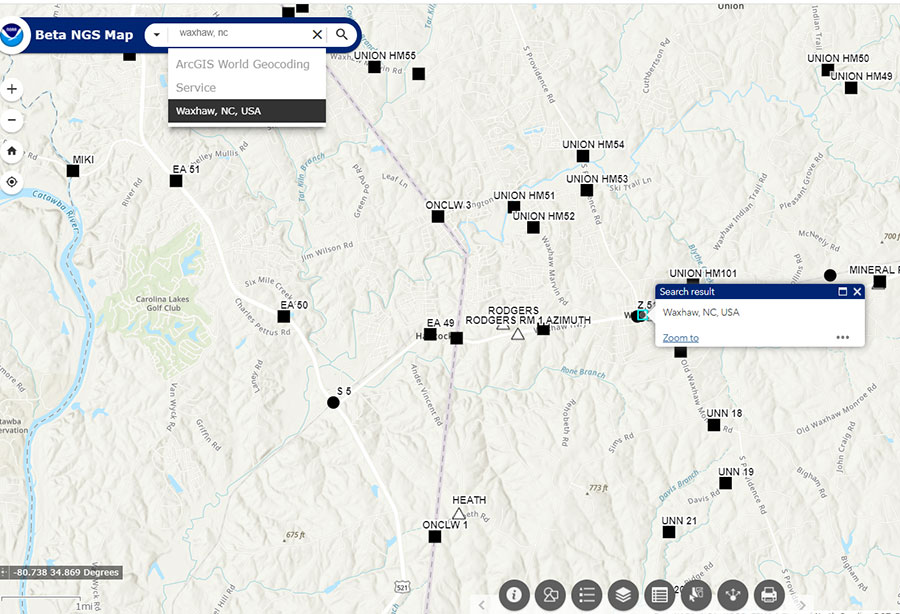
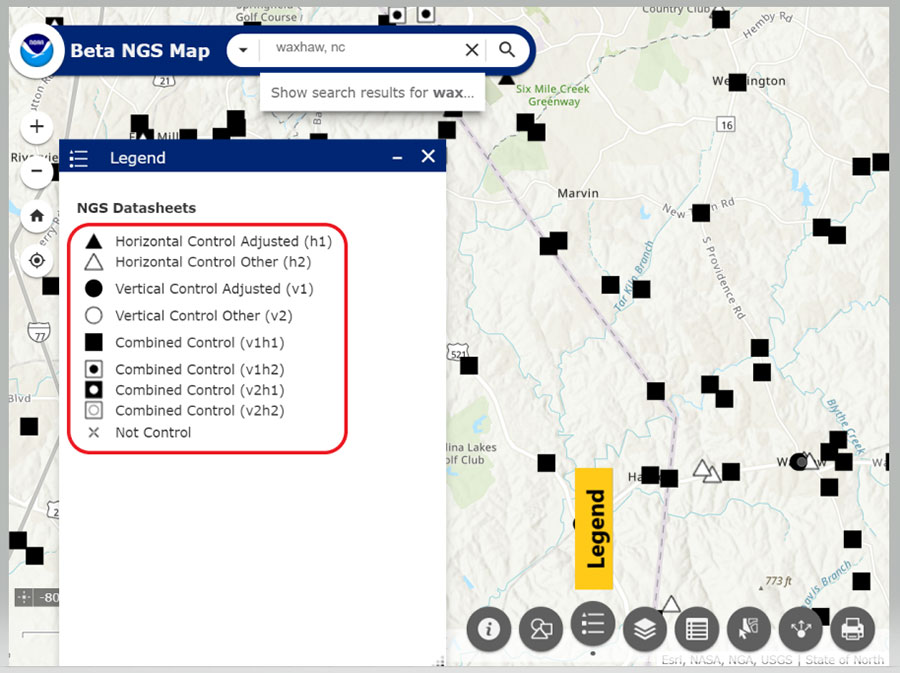
The map allows the user to type in a location (geographic location, CORS Site ID, OPUS PID, Datasheet PID or Datasheet Name) to start a search. See the “Waxhaw, North Carolina, Region” map as an example of entering a geographic location.
The bottom navigation bar has eight buttons.
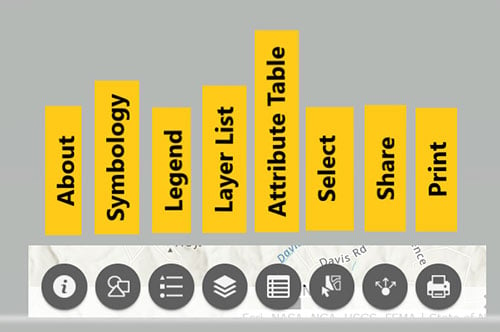
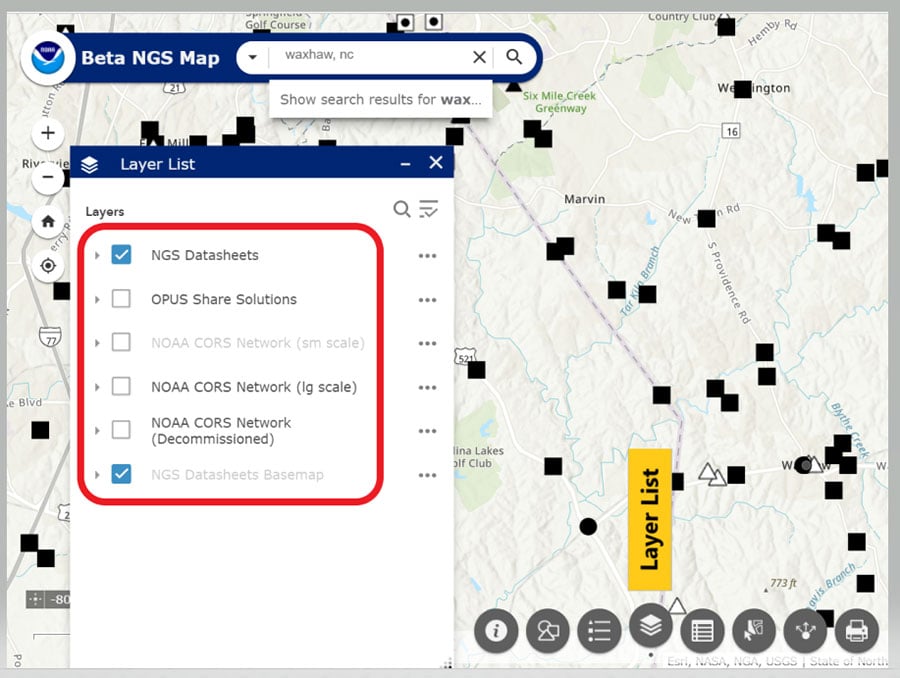
When clicked, a window pops up providing information about that particular button. (For example, see “Map with Legend Information” below.) The legend will include all layers that have been selected. In my example, the datasheet layer was the only layer I had selected (see “Map with Layer Information”.)
When the user clicks on a symbol, a box will appear with information about the mark. See “Information for Station UNN 12” below.
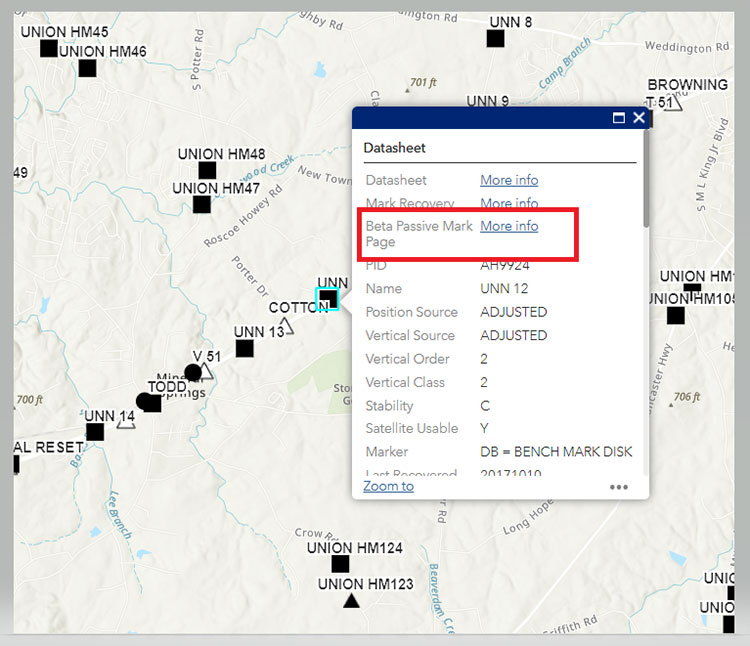
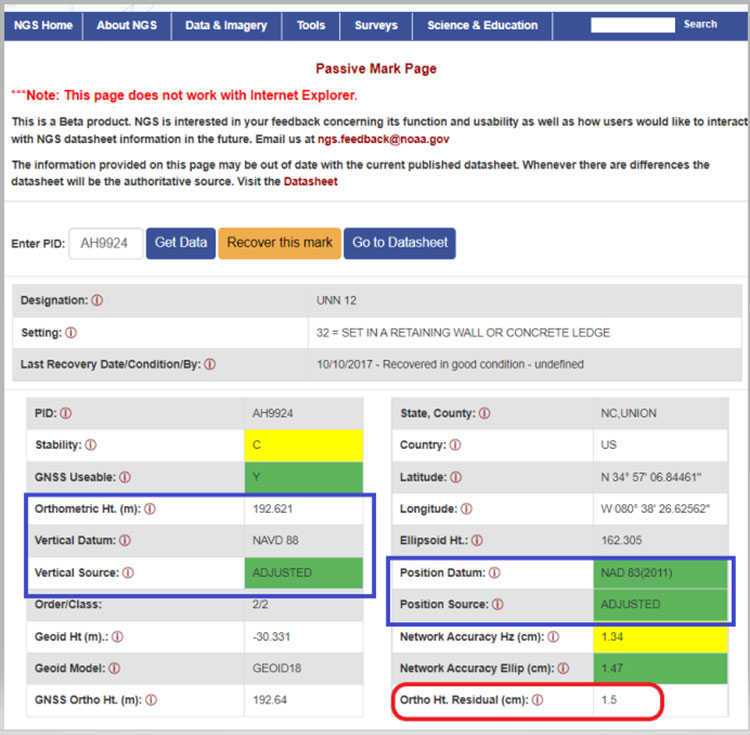
The box contains information from the NGS datasheet as well as a link to the actual NGS database. A nice feature of this webtool is that it provides a link to NGS’s Beta Passive Mark webtool. My October 2020 Survey Scene column highlighted the features of the NGS’s Passive Mark tool. The box captioned “Passive Mark Page for Station UNN 12” is an example of the tool. I’ve highlighted several items important to individuals planning surveys, such as the mark’s coordinates, datums and source, and the Orthometric Height residual (the difference between the estimated geoid height and the modeled hybrid geoid height).
Another great feature is that the user can click on the Mark Recovery link to provide the latest recovery information for a mark (see the box titled “Mark Recovery Link for Station UNN 12 “).

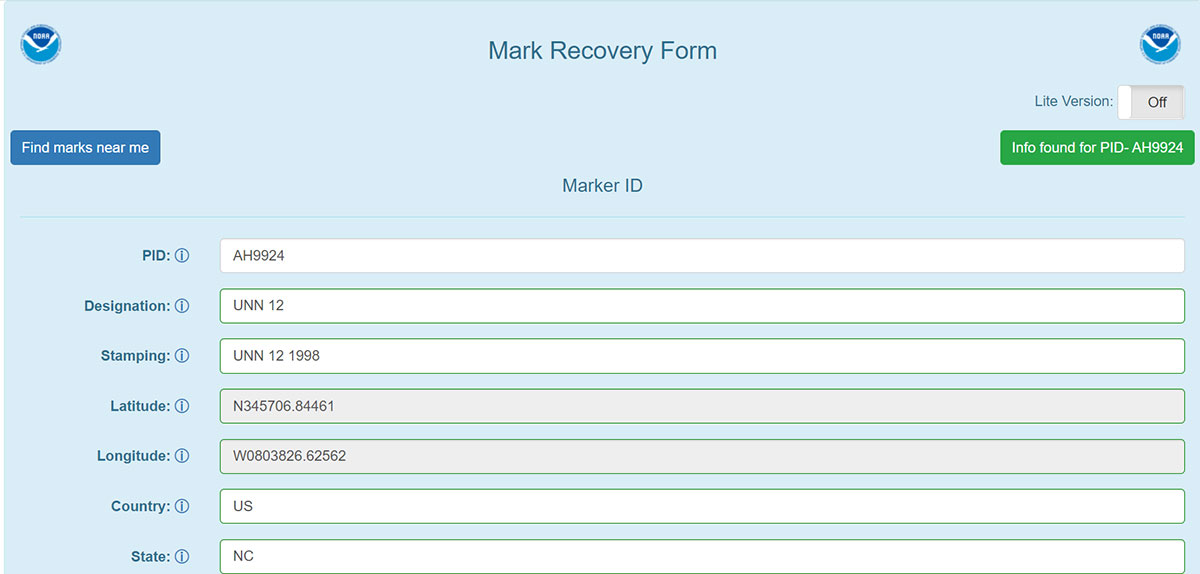
When a user clicks on the More info link for the Recovery Mark option, a Mark Recovery Form is provided for the user to enter the recovery information for the mark. The routine fills in the fields based on the current data in NGS’s database (see the box titled “Mark Recovery Form for Station UNN 12”). The user can enter changes or new information about the mark. This information is very important to users planning surveys. Just because a mark has been occupied by GNSS in the past doesn’t mean that it’s still a good station for occupation by GNSS. The environmental conditions around the mark could have changed since the last time it was occupied; for example, new buildings and/or growth of trees may now obstruct the GNSS signals.
As previously stated, the NOAA CORS Network is one of the layers available. The box titled “Map of NOAA CORS Network in the North Carolina Region” depicts the locations of the NOAA CORS in North Carolina. The layer list provides some of the attributes of the CORS, such as the sampling rate and which GNSS signal are collected at the site.

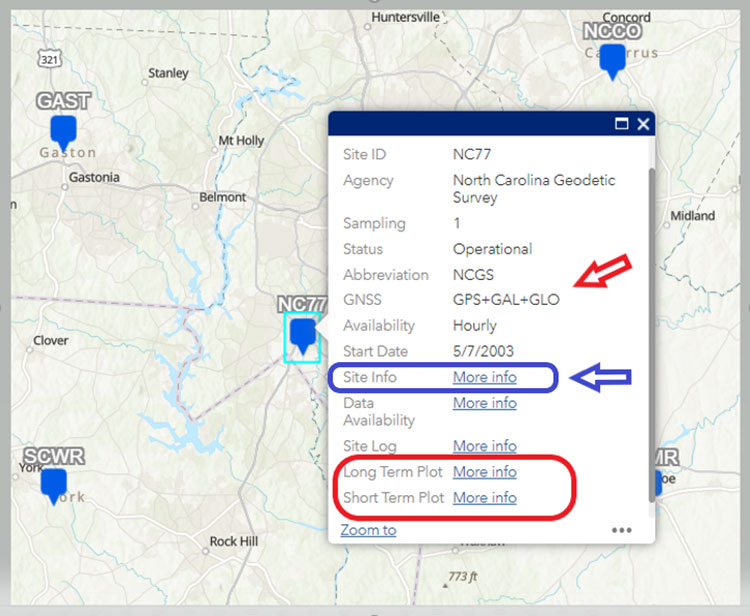
When a user clicks on a specific CORS, a box appears with information for that particular CORS. I’ve highlighted several items in the box titled “Information on CORS Site ID NC77.” In my example, CORS NC77 collects GPS, Galileo,and GLONASS data. Also, users can obtain long-term and short-term plots of the CORS.
Once again, this feature is important to users planning and performing GNSS survey projects. As in the other features, clicking on the More Info link will bring up the plots. The plots for CORS NC77 are provided in the boxes titled “Long-Term Plot Information on CORS Site ID NC77” and “Short-Term Plot Information on CORS Site ID NC77” below.
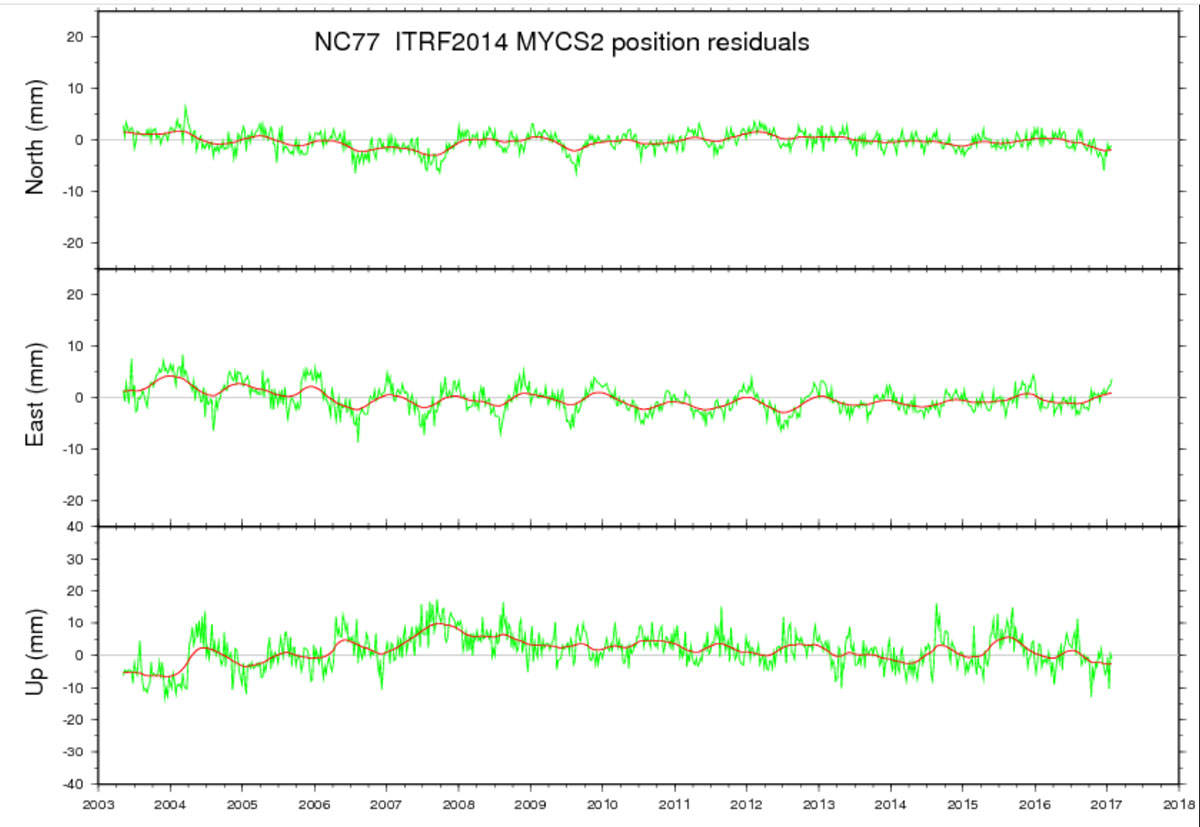
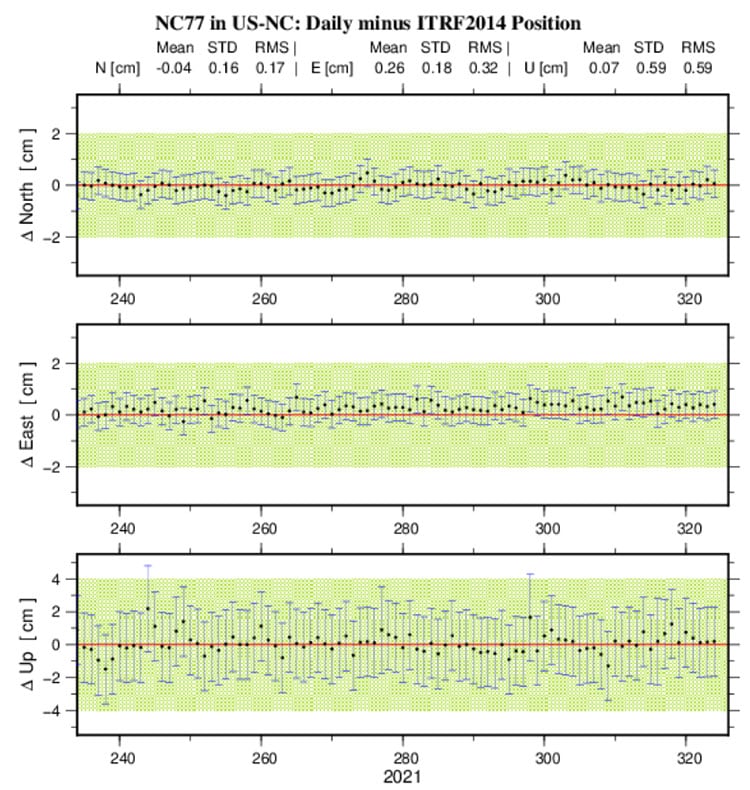
In the short-term plot, the red line is the published position, and the green hashed area is the tolerance of the NGS position, that is +/- 2 cm horizontal and +/–4 cm vertical. All the error bars are 1 sigma values. This information is useful when selecting NOAA CORS to be included in a survey project.
The short-term plot contains the mean, standard deviation and RMS values for the north, east and up components of the site. When planning a GNSS project, users typically identify several NOAA CORS to be included in the project. However, not all CORS are equal.
I evaluate CORS using the following criteria:
- Designated as “operational”
- Computed (i.e., measured) velocities rather than modeled (i.e., predicted) velocities.
- “Consistent” data depicted in short-term time-series plots.
- Network accuracies ~1 to 1.5 cm horizontally and less than ~2 to 3 cm in ellipsoid height.
Clicking on the More Info button for Site Info of NC77 provides a webpage where most of this information can be obtained.
Before conducting any post-processing, the analyst should ensure that all CORS included in the project have data for all of the occupations and that the station’s short-term plots indicate stability.
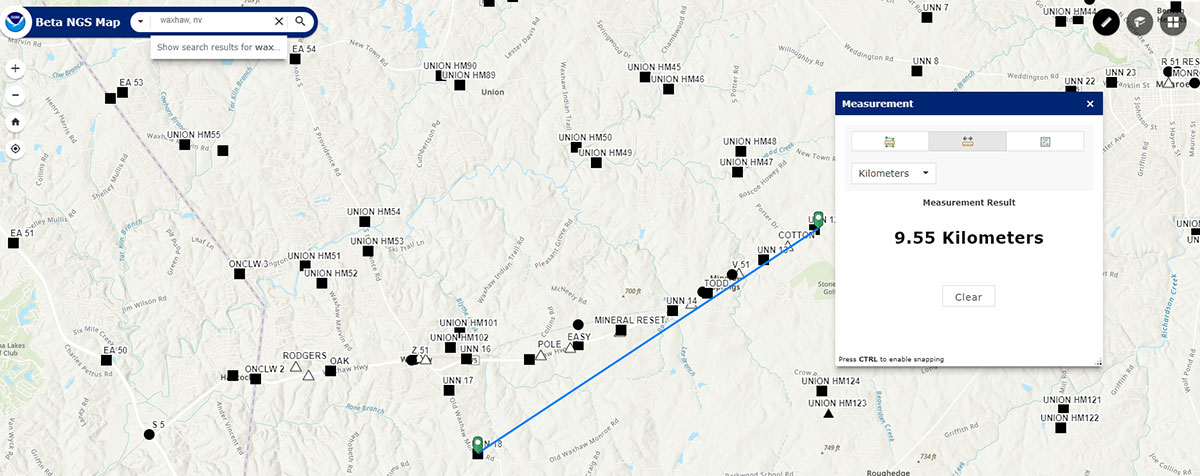
Tool buttons are situated in the top right section of the map. Included are a measurement tool to measure distances between marks and areas, a bookmarks tool to zoom to areas, and a basemaps tool to change the basemap. See the box titled “Useful Tools.”

Some users may find the measurement tool helpful when planning a survey. The box titled “Using the Measurement Tool” is an example of measuring the distance between two stations.
The last item that I’d like to highlight is that on Nov. 18, NGS has officially extended the GPS on Bench Marks campaign’s cut-off date for one year until December 31, 2022. See the box titled “NGS GPS on Bench Marks Notice.”
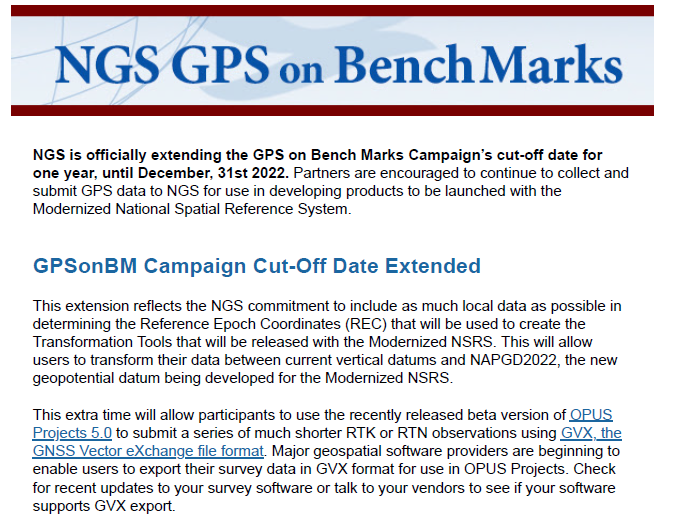
NGS is anticipating that this extra time will allow users to provide additional GPS on Bench Marks data using the recently released beta version of OPUS Projects 5.0.
OPUS Projects 5.0 enables users to incorporate their RTK and RTN observations and post-processed vendor data using the GNSS Vector eXchange file format (GVX). My October 2018 Survey Scene column described NGS’s GPS on Bench Mark program, and my October 2021 Survey Scene column described NGS’s Beta OPUS Projects 5.0.
As stated in the NGS news release, this extension reflects NGS’ commitment to include as much data as possible in determining the Reference Epoch Coordinates (REC) that will be used to create the Transformation Tools to be released with the Modernized NSRS.
I encourage everyone to try the new Beta NGS Map. As in all of NGS beta products, NGS would like users to try the tools and provide feedback on what they liked and what they didn’t like. They are trying to develop tools useful to everyone, but that won’t be possible unless they hear from users.