
No audio available for this content.
Constellation Roll-Out to Begin This Year
GeoOptics, a satellite-based environmental data services company, in cooperation with Atmospheric and Environmental Research (AER), an environmental research and development company, has announced the initial results of an Observing System Simulation Experiment (OSSE) showing the reliability of radio occultation data in improving predictions of severe weather and flash flood events.
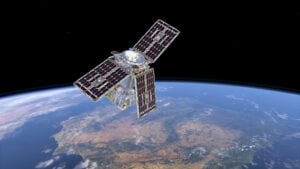
Using weather prediction models and data assimilation techniques, AER evaluated the potential benefit of observing Earth’s atmosphere with a vast future constellation of many hundreds of orbiting GNSS – Radio Occultation (GNSS-RO) receivers. As a case study, the model used the convective system that brought severe weather to Oklahoma in 2013, which included an Enhanced Fujita Scale-3 tornado and heavy rains.
“The improved characterization of moisture in the lowest 4-5 km of the atmosphere is very significant and, working with our colleagues at AER, we believe quite a rigorous scientific conclusion,” said Conrad Lautenbacher, GeoOptics CEO. “We see commercial provision of GNSS-RO as a valuable complement to public sector systems and a reliable, low-cost way to achieve the levels of scale tested. We are very excited by the results.”
Through collaboration begun in 2014, the two companies set out to assess the impact of vastly increased numbers of GNSS-RO profiles on regional weather forecasting within the context of a global weather satellite system. Oklahoma was the region of focus of the study, an area with a history of severe weather phenomena. Today’s total global GNSS-RO profiles number approximately 1,800 per day, of which 0.64 profiles per day are readings taken over Oklahoma.
In the study, AER and GeoOptics modeled from 50,000 to 2,000,000 global profiles per day through the deployment of the planned CICERO satellite constellation. Such large scale would correspondingly increase the profiles per day over Oklahoma to between 17 and 700.
GPS World discussed the use of GPS for radio occultation in its March 1994 Innovation column, “Monitoring the Earth’s Atmosphere with GPS,” by Rob Kursinski.
“We see commercial remote sensing and particularly the GNSS-RO technology as a paradigm change in developing and maintaining a cost-effective, next-generation operational observational infrastructure for environmental prediction,” said AER President Ron Isaacs. “The superb GNSS-RO technology knowledge base at GeoOptics provides an ideal and exciting complement to AER’s decades-long experience in today’s operational remote sensing and weather prediction practices, which include the current use of GNSS-RO sensing.”
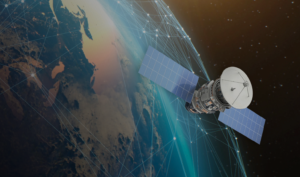
GNSS-RO profiles provide measurements of atmospheric temperature, moisture, and pressure with a precision unrivaled by other space-based techniques. The RO sensor gathers this information by precisely observing perturbations imposed on ubiquitous GPS radio signals as they pass through the atmosphere. Today, nearly 3,000 organizations in more than 80 countries use RO data in Numerical Weather Prediction (NWP) and research. NOAA’s own studies show that more accurate mid- to long-term forecasts can be made up to 15 hours sooner using the data collected from the current limited set of experimental GPS-RO sensors.
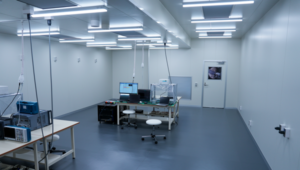
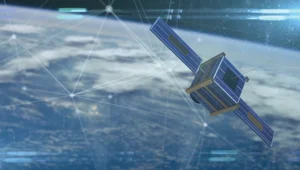
GeoOptics plans to launch an array of powerful GNSS-RO sensors on its CICERO constellation of low-Earth-orbiting satellites. The rollout of the constellation will begin in the third quarter of 2015 and will deliver more than 50,000 global profiles per day when fully deployed. As demand grows, the 24-satellite CICERO constellation will be expanded to carry additional and complementary instruments, such as scatterometry and gravity sensors.
“GeoOptics will advance a small satellite observing model that starts with GPS radio occultation,” Lautenbacher added. “We believe an integrated private company like ours can deploy such systems for a fraction of current costs to the government.”


seddik BOUTIOUTA
Thanks for this kind of articals , all my best wish