No audio available for this content.
By Tommaso Panicciari, Mohamed Ali Soliman and Grégory Moura
All images provided by the authors
A real-time system combining a simulator and a GNSS propagation model reproduces an authentic multipath environment. The propagation model relies on a 3D-model reconstruction of the urban environment, which generates a multipath signature strictly dependent on the location of the receiver’s antenna. This yields important results for a moving vehicle, which may be affected by very different multipath conditions depending on trajectory and location.
Positioning and navigation can be degraded in urban environments by multipath, and the error can increase considerably if not properly compensated. In situations where the line-of-sight (LOS) is obscured by surrounded buildings, the receiver may still be able to navigate by using the non-line-of-sight (NLOS) signal, which originates from single or multiple reflections/diffractions of the GNSS signal.
The use of 3D models has been one of the preferred solutions to recreate the multipath environment as seen by a GNSS device. This solution brings the capability to generate a multipath signature that is representative of the position of the antenna in a specific time and space. However, this solution comes with a certain degree of complexity. In fact, an accurate 3D model is required to simulate the obscuration of the GNSS signal, and a good propagation model is needed to generate phenomena like reflection and diffraction.

3D models have become more accurate and widely available and are mainly used to predict the satellite availability in specific locations, for example in evaluating the signal availability in urban canyon, and for both reflection and diffraction. Other uses of 3D models are as an aiding tool to assist navigation, sometimes together with an INS solution.
In this article, we present a novel real-time system capable of simulating realistic multipath in different environments. The system can simulate multiple GNSS constellations and is comprised of a GNSS simulator interfaced to a propagation model. The system can create a whole range of signals, effects, error models and trajectories in a real-time closed loop. The propagation model controls the simulation of multipath from the interaction of the GNSS signal with the 3D scene and objects. This article describes a novel real-time system for the simulation of realistic multipath in different environments and compares simulated and field-test data. The comparison is based on signal availability, horizontal error, carrier-to-noise (C/N0), pseudorange and Doppler residuals.
RAY-TRACING WITH 3D MODELING
The model simulates the propagation of GNSS signals in constrained environments, considering obscurations and multipath. It uses a proprietary ray-tracing kernel (based on bounding volume hierarchy techniques using processing unit [GPU] resources) coupled with geometrical optics and uniform theory of diffraction to compute the interaction between the signal and the local environment. The computation uses as main input a synthetic environment (that is, geometrical and physical modeling of a real or realistic environment) to assess the impact of obscurations related to signal availability issues and multipath (the cause of fading effects and performance problems).
The objective of ray-tracing is to find all the possible paths from the observer to the source of the signal considering a limited number of interactions per emitted rays. A ray-tracer (or ray-tracing algorithm) uses a primary grid to cast primary rays. Then, it iteratively computes the possible interactions between these rays and the virtual scene (often defined using triangles). If those interactions exist (if they comply with the law of physics) and if the number of interactions to reach the emitter is below the maximum number of interactions set by the user, then a ray (or multipath) is created. This is a deterministic method that can be used to calculate the obscuration due to the local environment (and therefore detect the signal availability) and the geometrical characteristic of the computed path. Combined with physics modeling, path attributes such as received power, delay, Doppler, and phase are also provided.
The main characteristics of ray-tracing techniques to model GNSS propagation are:
- All the signals arriving at the receiver can be model-based on the virtual environment.
- As it is a deterministic method, the more realistic the environment modeling, the more compliant with reality the results. Moreover, the simulation results are repeatable.
- The specular multipath can be displayed in 3D, and the attributes (for example, receiver power, phase, polarization, Doppler, geometry of the ray) are known. For example, this is relevant when the effect and signature of the environment on the propagation signal need to be studied and understood.
Nonetheless, ray-tracing techniques must account for three major difficulties:
They are time-consuming algorithms. Indeed, depending on the complexity of the scene (defined in terms of the number of triangles), a combinatorial problem to find the possible multipaths reaching the receiver makes the ray-tracer very resource-demanding. That is the reason why the most difficult task to achieve during the coding of a real-time ray-tracing algorithm is to develop acceleration techniques to quicken the computation process. Several solutions exist to either improve the intersection determination (for instance, based on spatial hierarchies such as bounding volume hierarchy [BVH] techniques), or to decrease the number of cast rays (often based on adaptive sampling techniques), or even to replace rays with beams or cones. Moreover, it is possible today to use the resources of graphic boards to accelerate the computation. Indeed, as ray-tracing can be coded by a large number of primary functions that can be treated simultaneously, it can be easily ported into GPU.
Their accuracy depends on the resolution of the primary grid. Details and therefore rays may be missed if the 3D scene is made of small details. This issue is called aliasing. Aliasing artefacts are raised for instance in parts of the scene with abrupt changes (such as edges) or in complex areas with lots of constituent objects. Solutions (or antialiasing techniques) exist to overcome this issue such as adaptive or stochastic samplings.
When it is combined with geometrical optics, these algorithms only compute the specular rays. Even if some techniques exist to model the scattering signals, only physical optics can render the global signal with high fidelity.
MULTIPATH SIMULATION SYSTEM
The proposed system can model two of the main propagation issues encountered in urban environments, such as obscuration (which leads to limitations in signal availability) and multipath (which generates interference that causes fading of the signal and positioning errors). To model realistically such a complex phenomenon, the system uses a GPU ray-tracing algorithm combined with geometrical optics and uniform theory of diffractions. The ray-tracing algorithm relies on 3D-model reconstructions of the urban environment. The computed obscuration and multipath effects are then used to generate signal corrections (in terms of power, delay and Doppler variation) to be used in the GNSS simulator, which generates the carrier, code and navigation messages for different GNSS constellations into a single RF output. Some of the advantages of this system is its ability to run in real time, and to visually show all the reflections/diffractions of the GNSS signals that cause multipath interference.
Figure 2 shows the diagram of the system set up in conductive mode. The system includes a SE-NAV PC controller, simulator software suite controller, GNSS simulator and device under test (DUT). A different mode is also available called over the air (OTA). This mode uses an anechoic chamber and a set of antennas distributed uniformly to generate the RF signal including the multipath. The DUT can then be placed at the center of the chamber and will be able to receive LOS and NLOS signals from different angles of arrival.
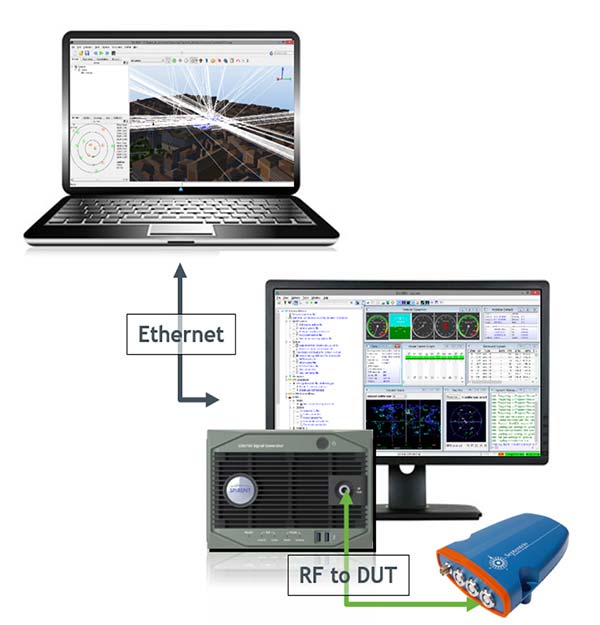
The GNSS simulator software suite is used to generate and control the generation of the satellite signals (including multipath) at RF, whilst the propagation simulator is used to calculate the propagation information (delay, Doppler and attenuation) of the reflected signals through a 3D urban model. The propagation software is interfaced with GNSS simulator software by means of a package of remote-control facilities that greatly enhances the flexibility of the propagation simulator. Those commands can be sent and received through the transmission control protocol/use datagram protocol (TCP/UDP) with different data streaming rates (10 Hz was used for this article).
It is also important to point out that the propagation simulator computes all the possible multipath signal generated by the 3D model given the position of the satellites and receiver. However, the physical limitation of the number of channels in the simulator causes the rejection of some rays. This rejection or filtering process can be done according to power (used in this article) or delay.
EXPERIMENT SET-UP
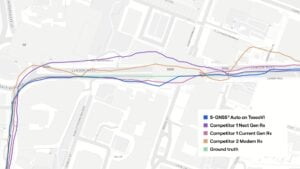
A set of different field-test campaigns where carried out in August 2016. Each campaign aimed to evaluate the ability of the system to assess the performances of a GNSS receiver using simulated signals in urban environments. Figure 3 shows the trajectory (blue line) used for the experiment in an urban environment — San Jose, California — with a static (a) and dynamic (b) scenario.
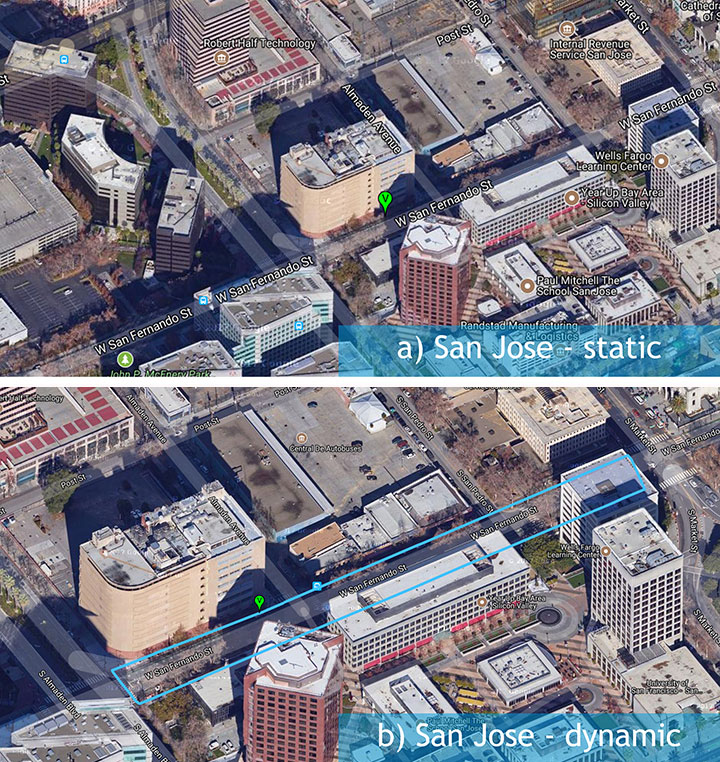
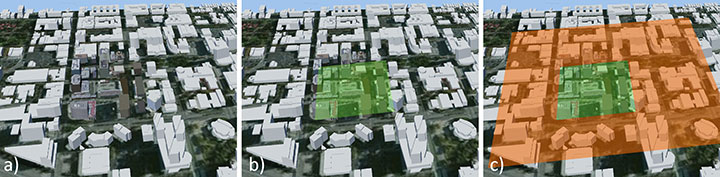
Figure 4 shows the 3D scene used to replicate the San Jose urban environment. The buildings in close proximity of the antenna (green area in Figure 4b) contain details like material, 3D facade and windows. In contrast, the buildings far from the antenna were only corrected for height, and the material was modeled as concrete only.
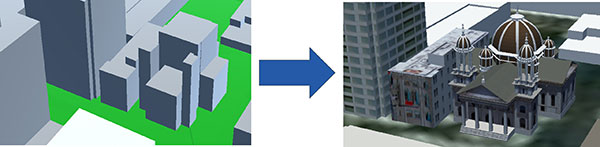
An exception was made for one building in San Jose because its complex architecture was believed to contribute to more reflected rays than would a more simplistic box (concrete) model (Figure 5).
EXPERIMENT RESULTS
A direct comparison of C/N0 power, pseudorange residual, and Doppler residual was performed between the field test and simulation.
San Jose Static Results. Figure 6 shows the results obtained from the San Jose static scenario for satellites PRN02 and PRN06: C/N0 ratio, pseudorange residual and Doppler residual for field test (blue line) and simulation (red line). Although the simulation sometimes creates deeper fading than in the field test, a first comparison indicates a good correlation of simulated data with field-test data.
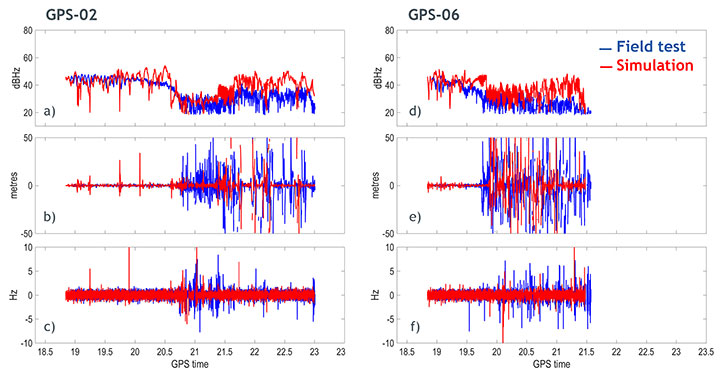
The signature of the multipath caused by this urban environment is visibly captured in the simulation. More interestingly, the pseudorange residuals and, to a lesser extent, Doppler residuals also indicate that the model is replicating the dynamics of the multipath environment in close correlation with the field test.
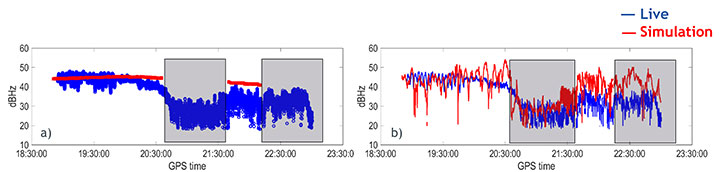
Figure 7 shows the C/N0 obtained from the field data (blue), and simulated data (red) with only obscuration (a) and with obscuration and multipath (b) for the static scenario.
It can be noticed that the receiver can still track PRN02 without the LOS, therefore, relying on just the NLOS signal. This can be clearly seen in Figure 7a where a sudden drop in power is associated to an obscuration of the same satellite (based on our 3D urban model).
Figure 7b shows the C/N0 obtained from the simulation (red line) when both obscuration and multipath were enabled. In this case the receiver could track the satellite even in the case of only NLOS as in the field test.
The positioning error for the San Jose static scenario is shown in Figure 8a. The simulation and field-test data have a comparable error. The error is relatively big at the beginning of the simulation and decreases after time 20.6. At the time 22.3, a moderate increase in the positioning error is visible in the field data until the end of the test. The simulation also shows a similar trend in this last part of the test, but tends to generate a higher positioning error.
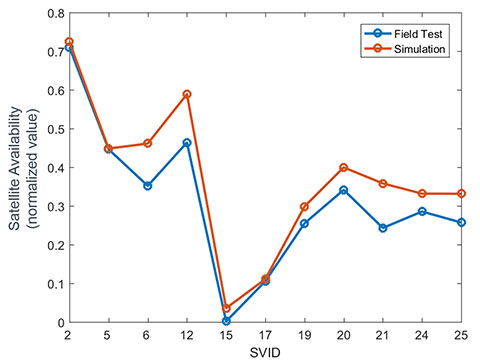
The satellite availability is shown in Figure 8b for both simulated (red) and field test (blue). The availability of the satellites generated with simulated data is in close relationship with the field data. However, some satellites could not be tracked in the simulation.

The importance of the accuracy of the 3D scene is evident in this example. In fact, we noticed that one of the buildings that was simulated as a simple concrete box was more complex in the real environment. Therefore, we applied some modifications to scene, as in Figure 9.
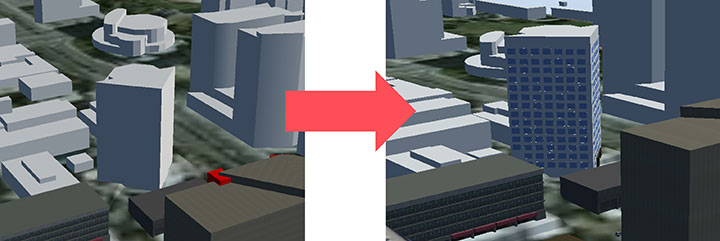
After those changes, a general improvement in the results was visible, but most importantly, the missing satellites could finally be tracked by the receiver (Figure 10).
SAN JOSE DYNAMIC TEST RESULTS
Similar results were obtained with the dynamic test in San Jose. Figure 11 shows the results obtained for satellites PRN12 and PRN24. The walking trajectory included two points where the antenna was stopped because of a traffic light. Those points correspond to a relatively flat C/N0 that can be clearly seen in the field test and simulation data for both PRNs. When, instead, the antenna was moving, a higher variation in the C/N0 is noticeable in both simulation and field test.

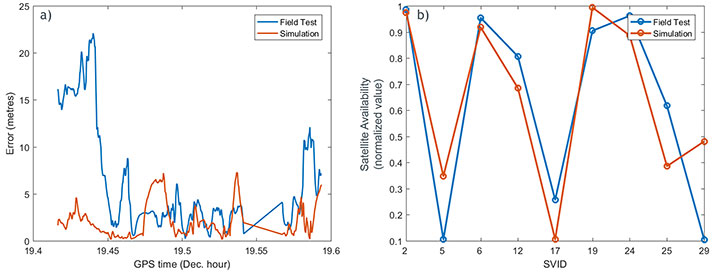
Figure 12a illustrates the positioning error obtained from simulated (red) and field test (blue). The first part of the simulation produced an error smaller than the one obtained from field data. However, from the time 19.48, a good agreement can be seen. The satellite availability is also shown in Figure 12b. This last result was obtained with the improved model described in Figure 9.
CONCLUSIONS AND FUTURE WORK
A new real-time system for multipath simulation is designed to generate realistic multipath that depends on time, position and type of urban environment. The 3D scene is used to calculate the multipath (reflection and diffraction) caused by the buildings and objects around the antenna.
Some first results demonstrated that realistic multipath can be generated by simulating reflections and diffractions even with a simple 3D model. However, the inclusion of finer details in the model can improve the simulation and make it even closer to reality.
As always, simulation interest is a tradeoff between reliability in all conditions and efforts to adapt (that is, to specify) a generic and simple model. The added value of our model consists in its simplicity and its good compliance with field data.
Ray-tracing techniques coupled with geometrical optics and uniform theory of diffraction are efficient and simple methods to simulate the propagation of GNSS signals in complex urban environments. Their efficacy is demonstrated by a good agreement between simulation and field measurements. Some discrepancies still exist and are due to the limitations of such a model:
- The accuracy of the model is never perfect and, as ray-tracing is a deterministic method, the returned results strongly depend on the quality of the input data used to generate the model.
- Geometrical optics is a simple (but efficient) method. Only specular rays are modeled, thus the system won’t be able to generate all the signals coming from other phenomena such as scattering. Another limitation is given by the hardware. In fact, the number of simulated multipath depends on the number of available channels in the simulator.
- The simulation parameters try to mimic the field conditions. However, the simulated trajectory is approximated, and other factors like pedestrian motion, vegetation (isolated trees or forest) and traffic may contribute to reduce some of the discrepancies that can be observed between simulation and field
All of these limitations can explain the differences between simulated and measured data. Currently, the impact of vegetation (forest and/or isolated trees) models, pedestrian motion and traffic on the multipath signal can also be simulated and their performances are under evaluation.
ACKNOWLEDGMENTS
We thank Colin Ford and Ajay Vemuru from Spirent Communications and Antoine Boudet, Yann Dupuy, Arnold Duquesne and Paul Pitot from OKTAL Synthetic Environment.
MANUFACTURERS
The system described in this article consists of a Spirent GNSS simulator equipped with a SimGEN software suite and the SE-NAV simulator developed by OKTAL Synthetic Environment. SE-NAV is interfaced with SimGEN via the SimREMOTE protocol, a real-time control and motion API.
Tommaso Panicciari obtained a Ph.D. in telecommunications from the University of Bath (UK). He is a software/project engineer at Spirent Communications where his main activity focuses on spoofing and multipath simulation.
Mohamed Ali Soliman is completing a master’s degree in telecommunications with business at University College London. He is a product manager at Spirent Communications, managing multiple products including the multipath simulation offering.
Grégory Moura graduated from the French Institute of Aeronautics and Space with an M.S. in cosmology from Université de Toulouse. He manages the GNSS activities of the French company OKTAL Synthetic Environment.