No audio available for this content.
Read Richard Langley’s introduction to this article: Innovation Insights: Antennas and photons and orbits, oh my!
To produce GNSS satellite orbit ephemerides and clock data with high precision and for all constellations, the Navigation Support Office of the European Space Agency’s European Space Operations Centre (ESA/ESOC) continually strives to keep up and improve its precise orbit determination (POD) strategies. As a result of these longstanding efforts, satellite dynamics modeling and GNSS measurement procedures have progressed significantly over the last few years, especially those developed for the European Galileo satellites. Because the accuracy of ESA/ESOC’s GNSS orbits has reached such a high level (about 1 to 3 centimeters), introducing a completely new type of GNSS satellite into the processing is not as easy as it used to be. New spacecraft models – the first and foremost being a model for a satellite’s response to solar radiation pressure (SRP) – are needed for the “newcomer” so that the quality of the overall multi-GNSS solution does not suffer. Just as important are spacecraft system parameters, or metadata, such as the location of the satellite antenna’s electrical phase center and the satellite attitude law.
In this article, we show the efforts we have made at ESA to bring the quality of our orbit estimates for the GPS Block III satellites up to par with those for Galileo and the earlier GPS satellite blocks. We report on the results from on-ground and in-flight determinations of the Block III transmit antenna phase center characteristics up to 17 degrees from the antenna boresight direction. Moreover, we take advantage of the non-zero horizontal offsets of the transmit antenna from the spacecraft’s yaw axis to estimate the satellite yaw angle during Earth eclipse season and present a simple analytical formula for its calculation. Finally, we describe the development and validation of improved radiation force models for the Block III satellites.
We start, however, by giving a brief overview of the GPS Block III program.
GPS BLOCK III
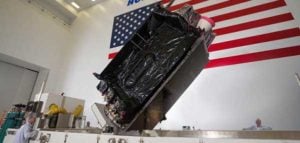
The U.S. Space Force GPS Block III (previously referred to as Block IIIA) is a series of 10 satellites being procured by the United States to bring new future capabilities to both military and civil positioning, navigation, and timing (PNT) users across the globe. Designed and manufactured by defense contractor Lockheed Martin (LM), the satellites are reported to deliver three times better accuracy, 500 times greater transmission power, and an eightfold enhancement in anti-jamming functionality over previous GPS satellite blocks. At ESA/ESOC, we are paying particular attention to this new tranche of satellites as they are the first to broadcast L1C, a new common signal interoperable with other GNSS, including Galileo.
At the time of this writing, there are six GPS III space vehicles (SVs) in orbit. The first one – nicknamed “Vespucci,” in honor of Italian explorer Amerigo Vespucci – lifted off atop a SpaceX Falcon 9 rocket from Cape Canaveral Air Force Station, Florida, in December 2018, and entered service on January 13, 2020. An additional four SVs are expected to be launched soon, before moving on to an updated version called GPS IIIF (“F” for Follow On). The first Block IIIF satellite is projected to be available for launch in 2026.
In view of the growing number of GPS III SVs in orbit, and soon to be joined by IIIFs, accurate spacecraft models and metadata information are becoming more and more important in order to maximize PNT accuracy.
SATELLITE ANTENNA PHASE CENTER PARAMETERS
GNSS signal measurements refer to the electrical phase center of the satellite transmitting antenna, which is neither a physical nor a stable point in space. The variation of the phase center location as a function of the direction of the emitted signal on a specific frequency is what we call the phase center variation (PCV). The mean phase center is usually defined as the point for which the phase of the signal shows the smallest (in a “least-squares” sense) PCV.

The point of reference for describing the motion of a satellite, however, is typically the spacecraft center of mass (CoM). The difference between the position of the mean phase center and the CoM is what we typically refer to as the satellite’s antenna phase center offset (PCO). Both PCO and PCV parameters must be precisely known — from either a dedicated on-ground calibration or one performed in flight — so that we can tie our GNSS carrier-phase measurements consistently to the satellites’ CoM.
On-Ground Calibrations. Like for previous GPS vehicles, the Block IIR and Block IIR-M satellites, LM has fully calibrated the GPS III transmit antennas prior to launch at their ground test facilities. Antenna offset parameters for all three carrier signals (L1, L2 and L5) were posted on the U.S. Coast Guard Navigation Center (NAVCEN) website (www.navcen.uscg.gov) shortly after each satellite launch. In December 2021, NAVCEN released the PCOs for SV number (SVN) 78, along with updates to the first four satellites (see Table 1). About ten months later, in October 2022, the antenna pattern for each satellite and signal frequency were published (see Figure 1).
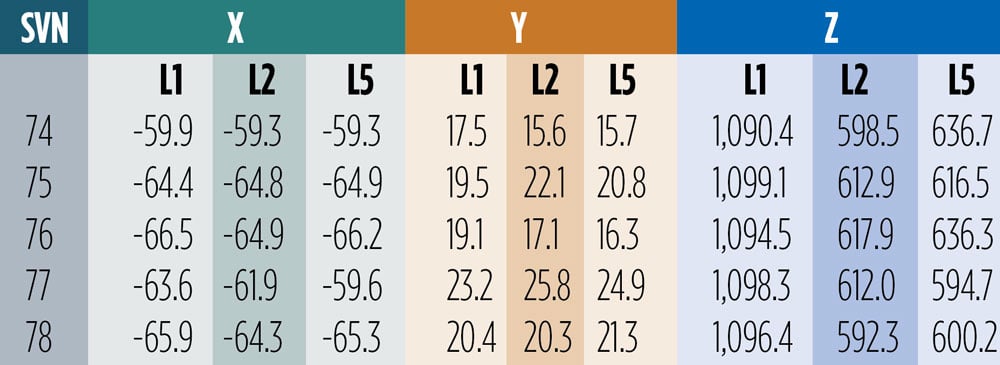
The December 2021 offsets are referred to as predicted values at the end of year one on orbit. They differ from the previous ones by several centimeters in both vertical (Z) and horizontal (X and Y) directions. Particularly surprising are the X- and Y-PCOs, which were initially reported to be close to zero. The differences in the horizontal PCOs have generated uncertainty and debate, especially within the International GNSS Service (IGS) about which values to adopt for the new antenna model release (igs20.atx). Testing of the two different PCO datasets in our software demonstrated that the non-zero values as given in Table 1 are the significantly more accurate ones. We will return to this later in this article.
Combined Ground- and Space-Based Tracking. In this part of this article, we discuss the combination of dual-frequency tracking data from geodetic-quality GPS receivers in low Earth orbit (LEO) with those from a global receiver network on the ground to determine the phase center parameters of the GPS Block III transmit antennas. The LEO-based measurements were taken by the GNSS receivers on board the ocean altimetry satellites Sentinel-6 Michael Freilich and Jason-3. The 1,336-km altitude of both of these missions enables the estimation of the GPS satellite antenna PCVs from 0 up to 17 degrees from boresight while GPS receivers on Earth can only see the satellites up to a maximum angle of 14 degrees. The 14-degree limit is also referred to as the GPS satellites’ edge of Earth (EoE) angle.
For the modeling of the PCVs we follow the approach of the IGS using piece-wise linear functions of the boresight angle and constraining the PCV values to between 0 and 14 degrees to have zero mean. Furthermore, we employ fully normalized spherical harmonic expansions of degree 8 and order 5 to solve for the azimuth- and elevation-angle-dependent PCVs of the orbiting receiver antennas. The IGS standard antenna phase center corrections from igs20.atx are applied to all terrestrial receiver and GPS Block II transmit antennas.
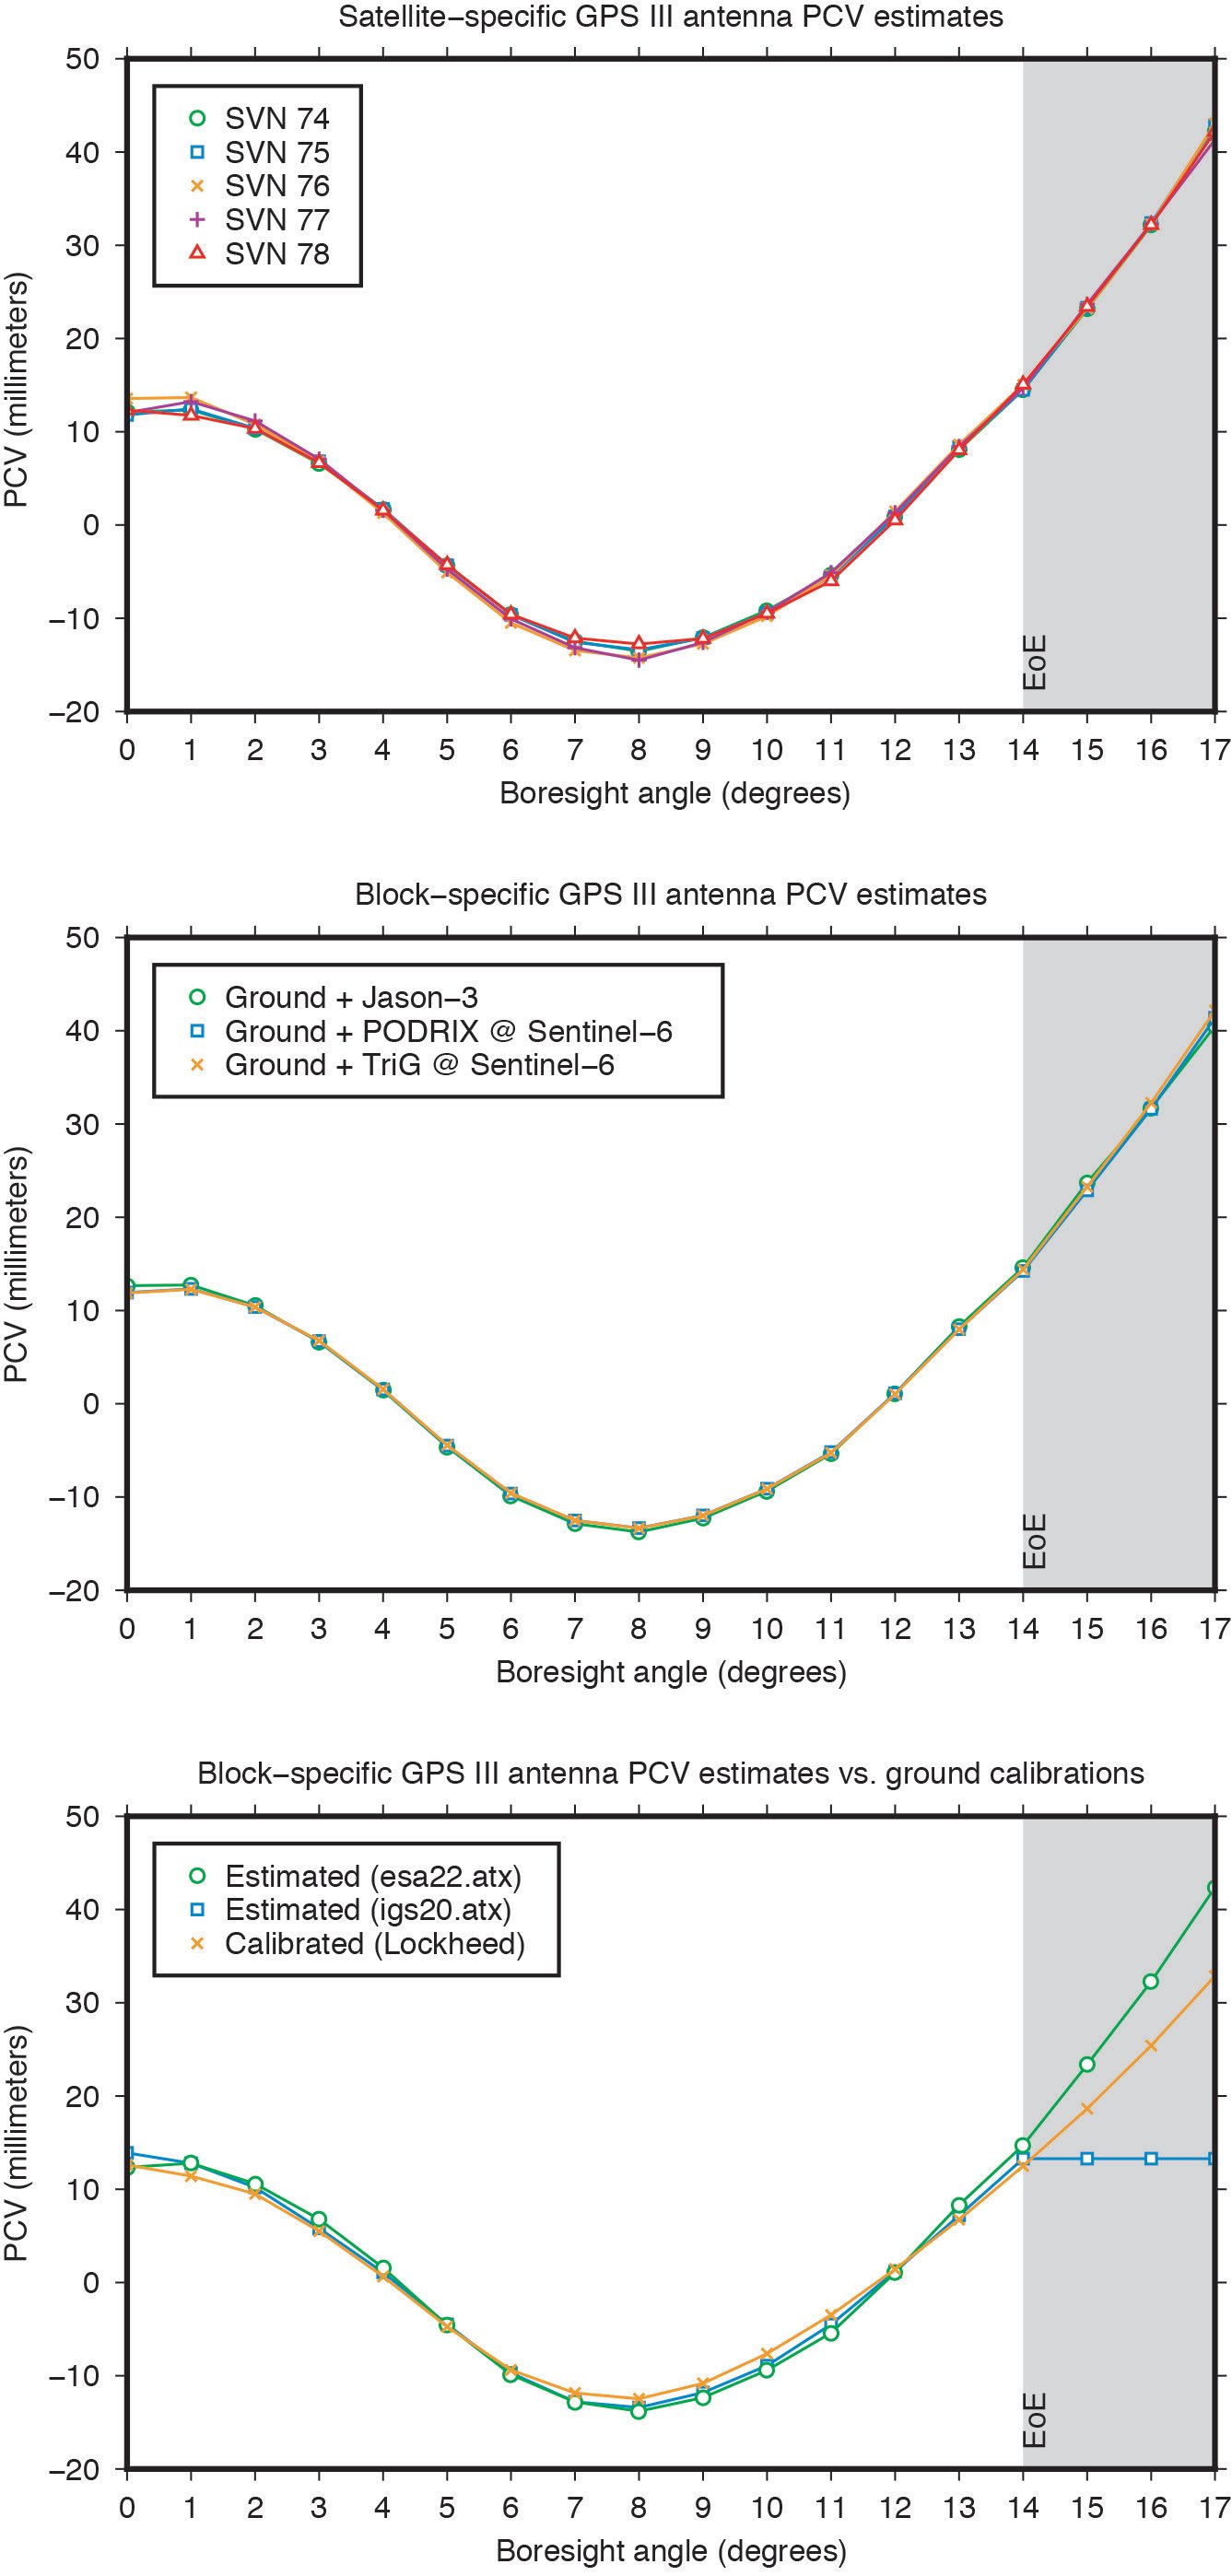
The estimated Block III antenna PCVs are depicted in Figure 2. The estimates for the five individual antennas match each other to within 0.4 millimeters root-mean-square (RMS) (see Figure 2, top). The agreement among the PCVs that we get when processing the tracking data from each LEO receiver’s antenna separately is at the sub-millimeter level, too (see Figure 2, middle). Overall, the level of consistency suggests that the PCVs are of very good quality and that a block-specific representation is sufficient for precise applications. Comparison of the final block-specific PCV estimates against the values from the current IGS antenna model and from the ground calibrations shows strong agreement (RMS = 0.7 millimeters) between 0 and 14 degrees from boresight (see Figure 2, bottom). Beyond the 14-degree limit, the differences compared to the IGS standard are up to three centimeters, underlying the urgent need for an update of the igs20.atx file.
Applying the extended PCV corrections as part of the POD process to the GPS LEO receiver data shows significant improvement in the post-fit carrier-phase residuals when compared to the PCV corrections from the IGS legacy model. It removes a previously existing boresight angle-dependent trend and leads to a more than 20% reduction in the computed residual RMS (see Figure 3).

YAW MODELING
GNSS satellites cannot follow an ideal yaw-steering whenever the Sun elevation angle relative to the orbital plane (the so-called beta angle) gets too low and the yaw rate required to keep the satellite solar panels pointing towards the Sun exceeds the maximum satellite yaw rate. The strategies on how GNSS satellites perform rate-limited yaw-steering are different for each type of spacecraft and only partly documented for public users. Continuous knowledge of GNSS spacecraft yaw attitude, however, is important for kinematic and dynamic reasons. Errors in yaw are known to affect the modeling of transmit antenna phase center’s position, carrier-phase wind-up, and radiation pressure forces. On the other hand, when the mean antenna phase center location is offset from the spacecraft’s Z-axis, the satellite yaw state can be estimated instantaneously from the tracking data of a global receiver network. The approach behind this is commonly referred to as “upside down” or “reverse kinematic precise point positioning” (RPP). The horizontal antenna offset vector can be viewed here as a kind of rotating lever arm whose length determines the accuracy of the yaw angle estimates. Since the Block III X-offset is just 7 centimeters, one should not expect the same RPP accuracy as for other GNSS satellites like those of the GPS IIF or GLONASS-M series, which have an X-offset that is six (GPS IIF) or even eight (GLONASS-M) times larger.
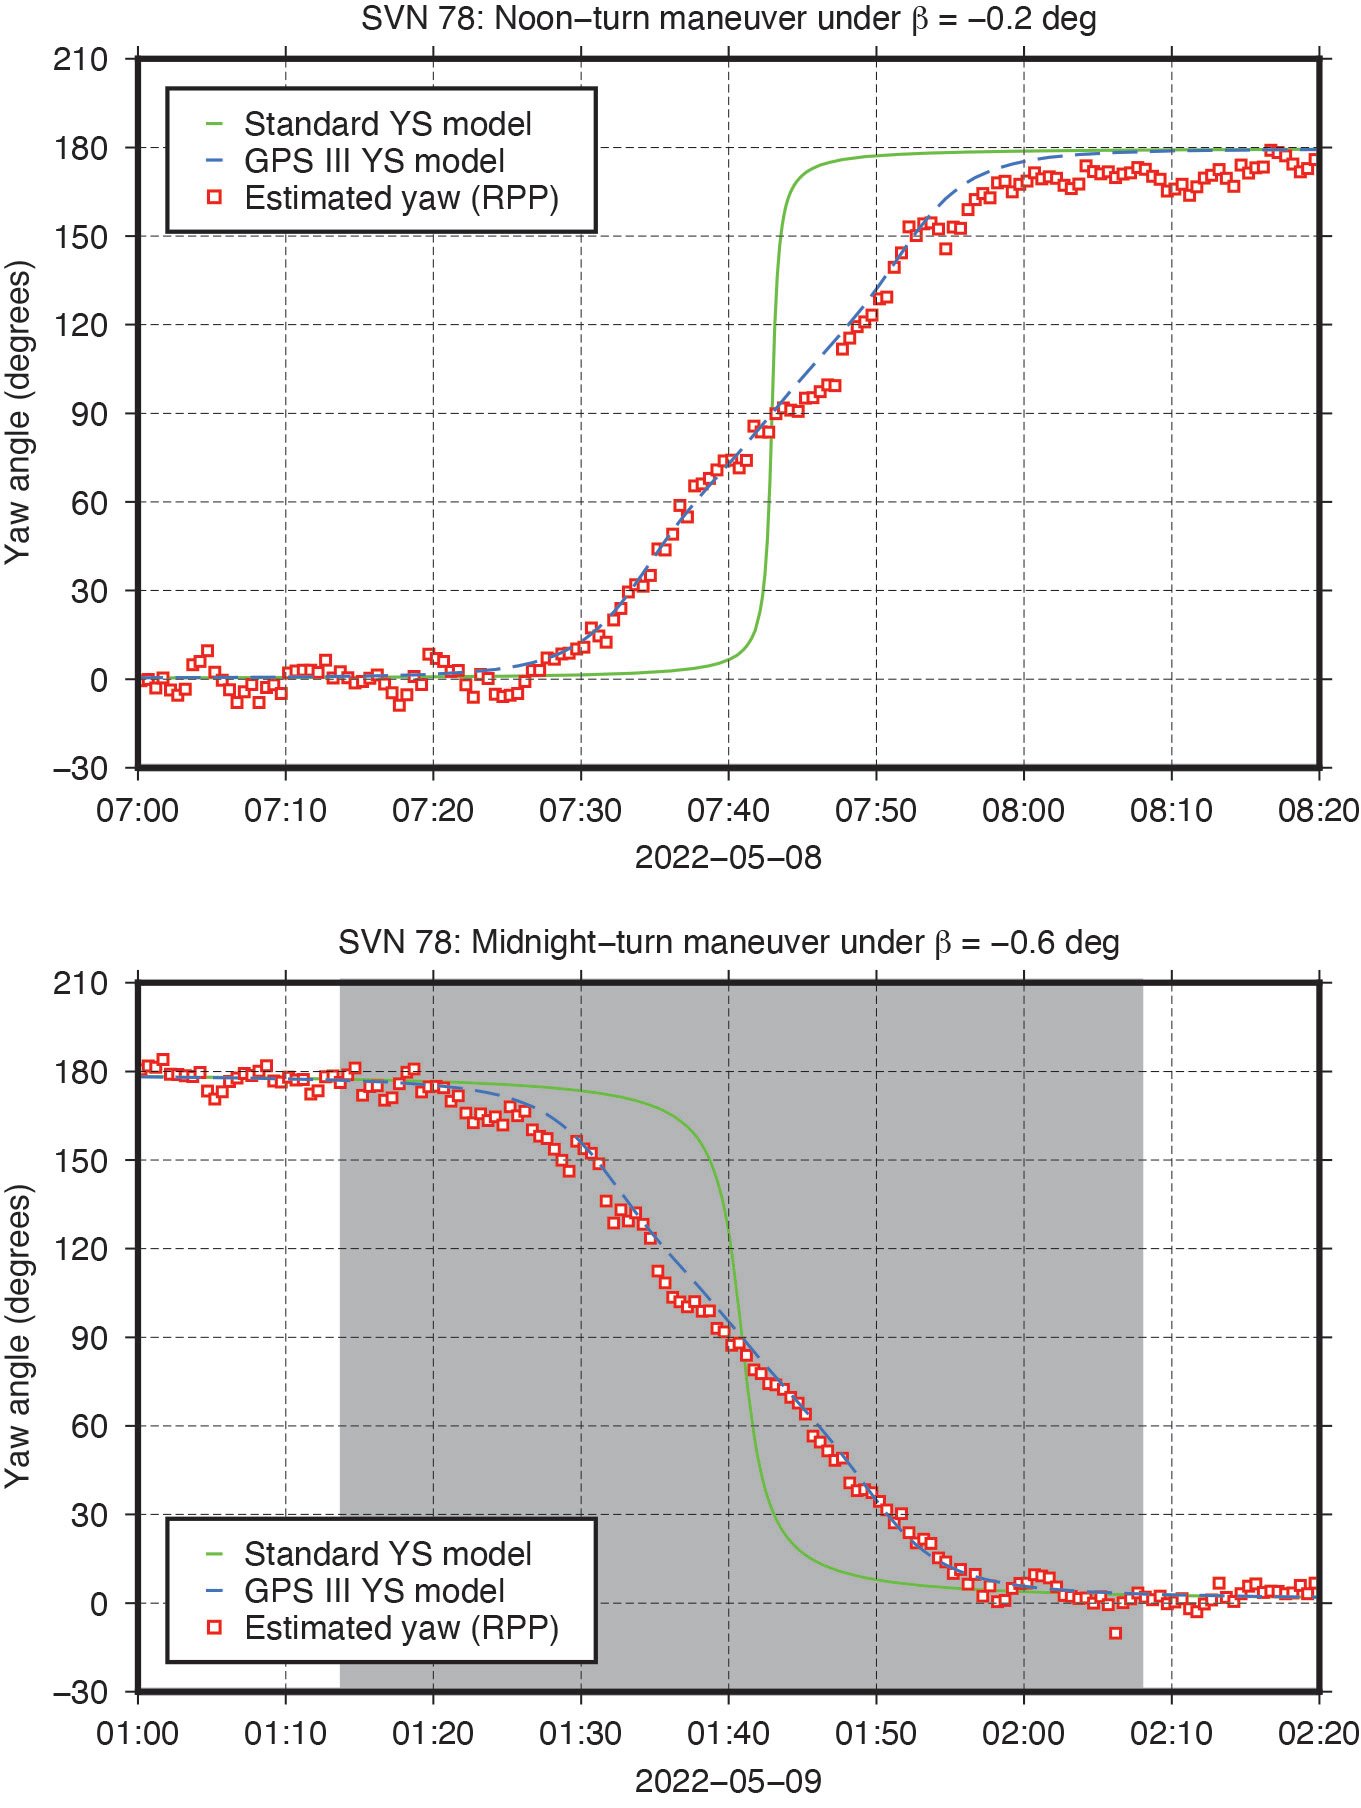
Nonetheless, with more than three hundred ground stations, kinematic RPP works reasonably well even for GPS III as we can see from Figure 4, which shows the estimated yaw angle of SVN 78 while passing orbit noon and orbit midnight with a Sun elevation angle of almost zero degrees. The plots suggests that Block III satellites — unlike previous Block IIA and IIF SVs — perform their yaw slews near noon and near midnight in the same way and at the same yaw rate. In this respect, the yaw turn behavior is similar to that of the IIR/IIR-M satellites. However, with a maximum yaw rate of 0.10 degrees per second, the Block III satellites rotate only half as fast as those of the IIR/IIR-M family. What is also different is the start time of the yaw maneuver. As can be seen from Figure 4, the maneuver does not start when the required yaw rate exceeds the physical limit but already a couple of minutes before.
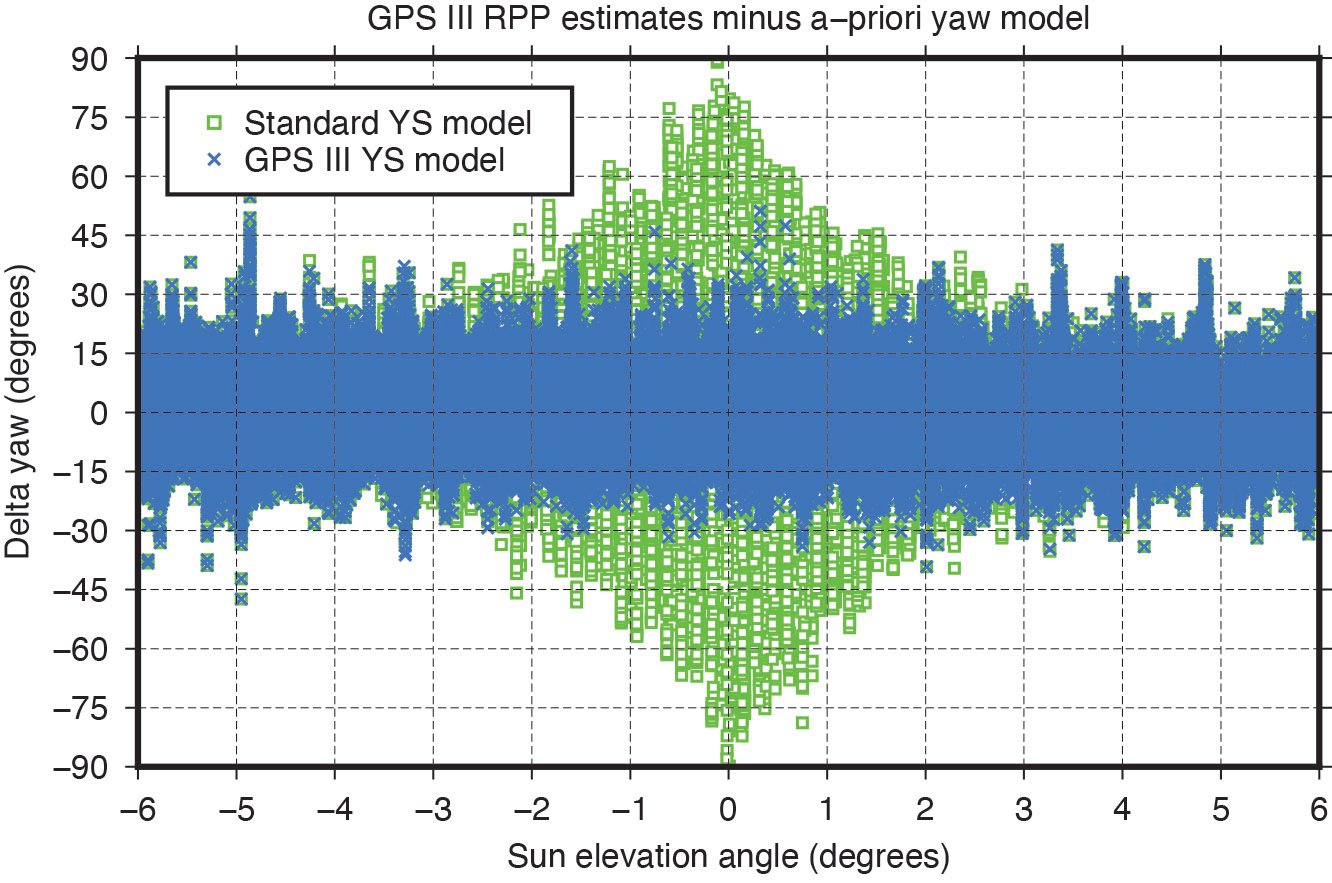
The RPP analysis has led to the development of a simple yaw model for the Block III satellites. For a Sun elevation angle β below β0 = 4.780 degrees, the yaw angle can be approximated with an RMS accuracy of about 8 degrees by the following formula:
whereas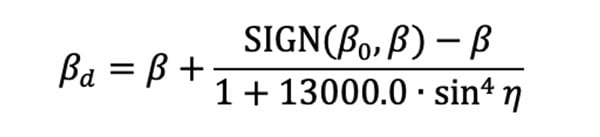
is a modified Sun elevation angle, SIGN(β0, β) a FORTRAN function returning the value of β0 with the sign of β, and η is the satellite’s argument of latitude with respect to orbit midnight. The agreement between estimated and modelled yaw angles is illustrated in Figure 5.
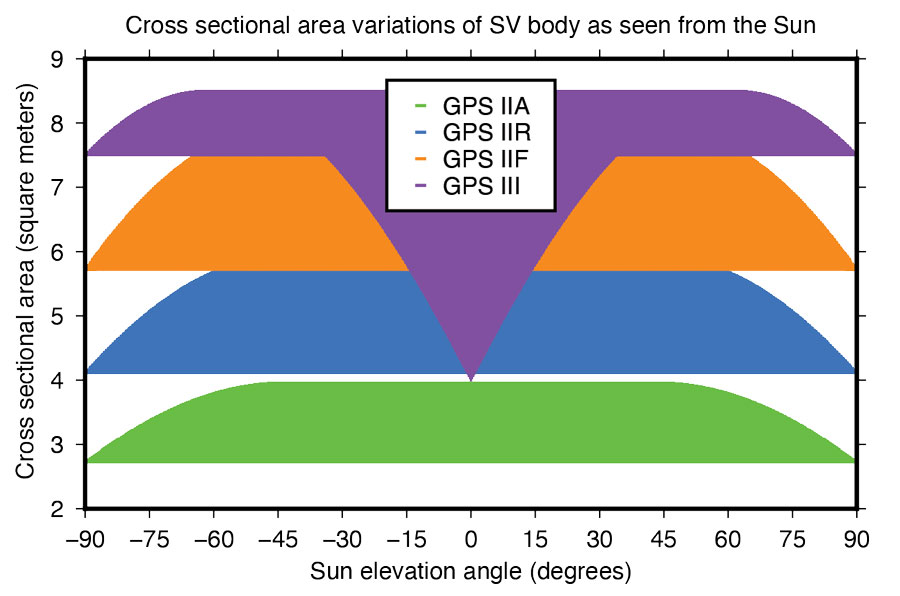
Fourier Series for Radiation Force Modeling. The most critical component determining the shape of a GNSS satellite’s trajectory is SRP – the force caused by the impact of solar photons hitting the satellite’s surfaces. A satellite’s sensitivity to SRP can be characterized by the variation of the cross-sectional area to mass ratio (A/M) of the satellite body as it orbits Earth and the Sun. The greater the change in A/M, the higher the sensitivity. From this perspective, the Block III spacecraft can be considered the most sensitive in GPS history.
Based upon LM’s tried-and-true A2100 bus, the satellite is much more elongated than previous generations. With an estimated size of 7.5 meters squared, the X-side is almost twice as large as the Z-side. Depending on the elevation angle of the Sun relative to the orbital plane, the body’s cross-sectional area exposed to sunlight varies between 4.0 and 8.5 meters squared (See Figure 6). With a nominal on-orbit weight of approximately 2,160 kilograms, this results in a change of A/M of 0.0021 meters squared per kilogram. For comparison, the corresponding values for the previous GPS SVs are 0.0015 (IIF), 0.0017 (IIR), and 0.0013 (IIA) meters squared per kilogram.
Given the size and shape of Block III spacecraft, an appropriate radiation force model is considered mandatory to achieve the highest orbit accuracy possible. With that said, we empirically derived a set of background force models for the first five GPS III satellites. Our approach rests on dynamical long-arc (9-day) fitting to precise orbit data spanning up to three years and the following low-order Fourier functions of the Earth-spacecraft-Sun angle ε to represent the radiation force in the satellite body-fixed system:
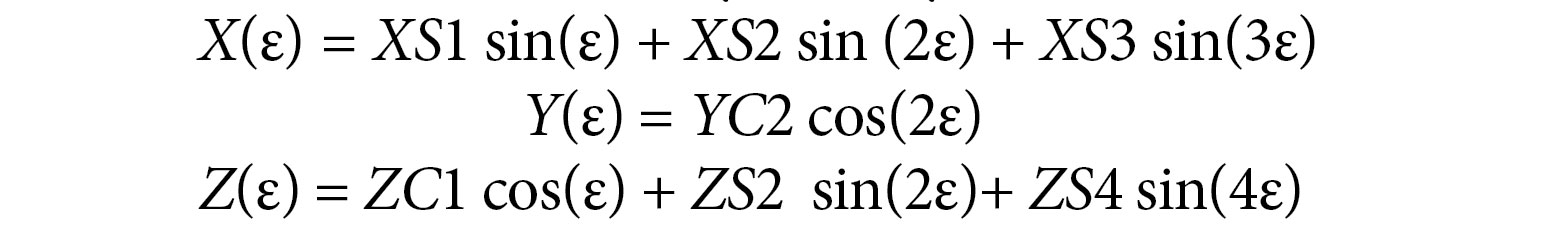
The Fourier coefficients (XS1, XS2, XS3, YC2, ZC1, ZS2 and ZS4) are iteratively adjusted together with initial epoch state, a constant Y-axis bias, and 1‐cycle per revolution along‐track parameters to best fit the orbit data in a least-squares sense. All individual 9-day arc solutions are rigorously combined on a normal equations level to form a robust set of Fourier model coefficients for each satellite or group of satellites.
ORBIT OVERLAP TESTS
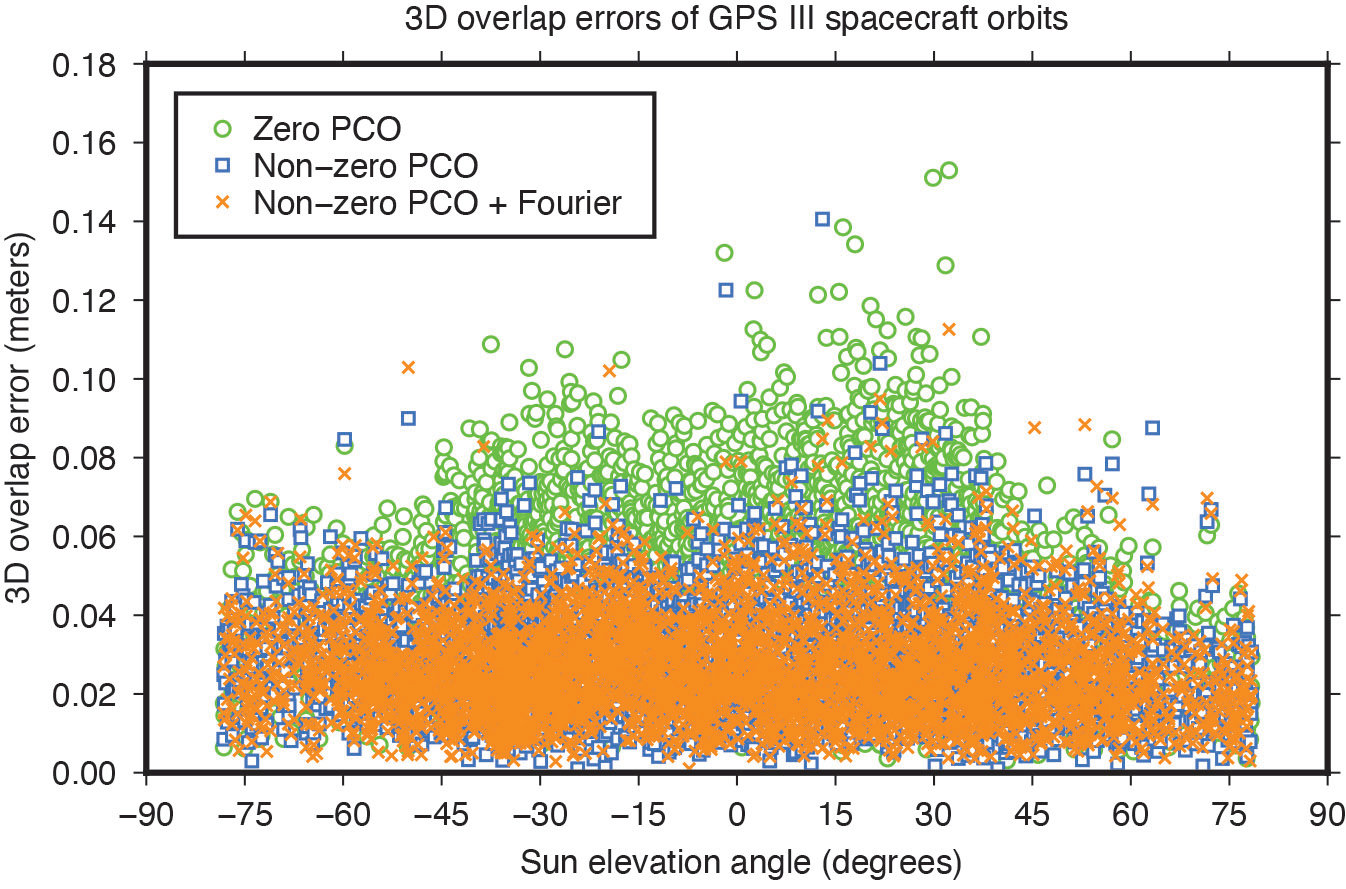
To investigate the effect of the transmit antenna PCOs and the Fourier force models on the satellite orbits, we use our ESA/IGS processing strategy to generate dynamic 24-hour-arc solutions spanning January 2020 to December 2022, first with zero PCO and the non-zero horizontal offsets from Table 1 and no a-priori radiation force model, then with the non-zero offsets and the additional Fourier model in the background. The direct comparison of the generated orbits reveals significant differences for the Block III satellites of about 0.1 meters (3D).
To demonstrate the improved performance of the non-zero offsets and the Fourier model, we take the orbits for successive days and look at the midnight epoch where they overlap. The difference in the orbit position, subsequently referred to as “overlap error,” gives us a worst case estimate of the satellite orbit accuracy. Comparison of the overlap errors provides evidence that the Block III orbits are much more accurate when using the non-zero rather than the zero X and Y PCOs. The overall 3D overlap RMS reduces from 49.5 millimeters (with zero PCOs) down to 32.3 millimeters (with non-zero PCOs). Results for the Sun elevation regions below 45 degrees, in particular, show significant improvement (see Figure 7).
Use of the Fourier model has additional positive impact on the overlaps. Comparing the orbits produced with and without the a-priori radiation force model, we see a decrease in the 3D overlap error RMS from 32.3 to 29.7 millimeters averaged over all satellites. The orbit component that benefits most from both the improved antenna phase and the advanced force modeling is the one normal to the satellite orbital plane (across track). The SVs improving the most are SVN 75 and SVN 78, though significant improvements can be seen for all other satellites too (see Table 2).

EMPIRICAL PARAMETER ESTIMATES
Another means of assessing the quality of spacecraft models is the size and variability of the five-plus-three empirical dynamic radiation pressure parameters that we still estimate on a daily basis for each GNSS satellite in addition to its a-priori force model. Introducing the non-zero PCO and Fourier models into the POD turned out to reduce the size of the empirical parameters and their dependency on the satellite-Sun geometry to a great extent as the example in Figure 8 demonstrates.

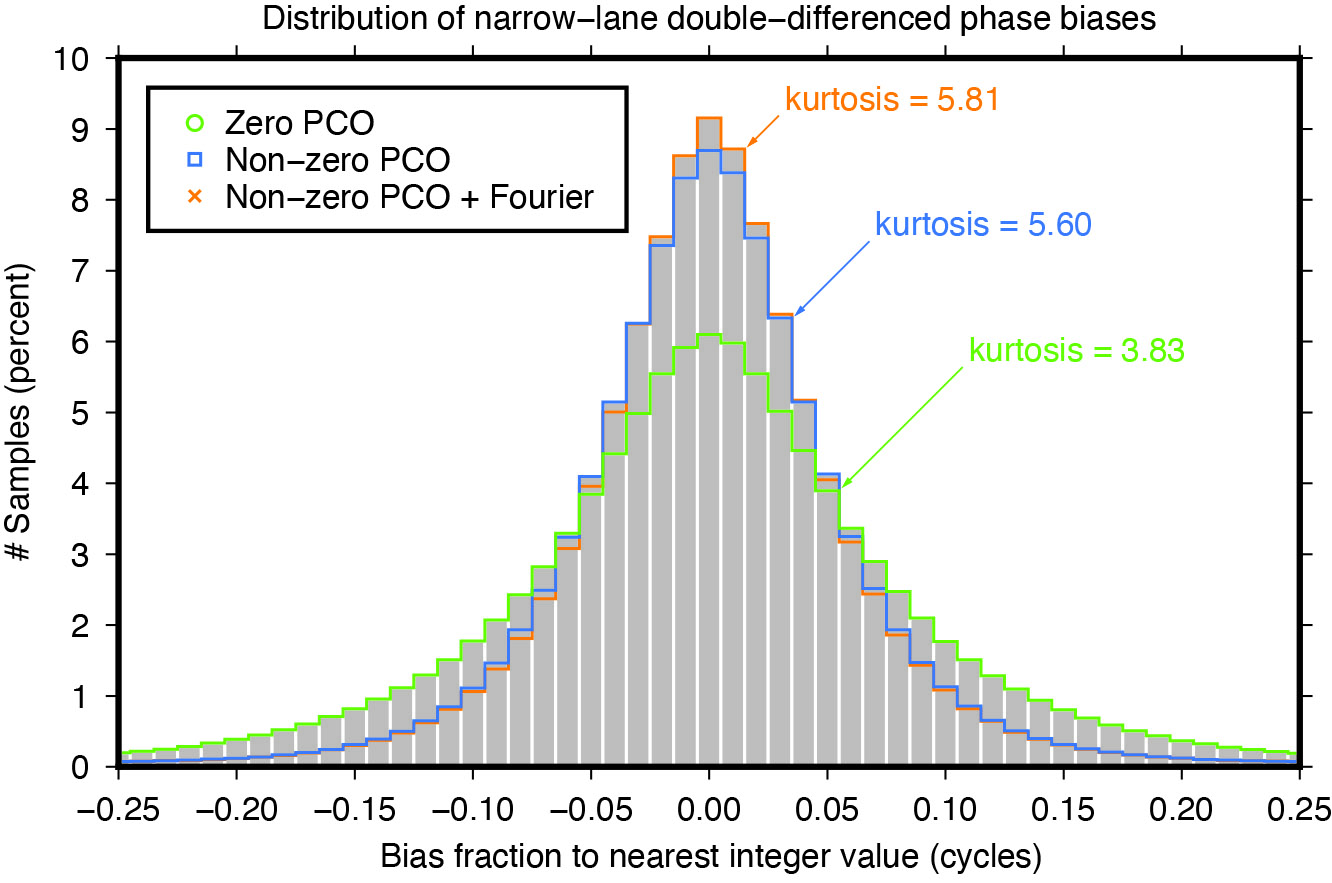
NARROW-LANE AMBIGUITY FRACTIONALS
Integer ambiguity resolution — that is, resolving the unknown cycle ambiguities of double-differenced carrier-phase data to integer values — is considered indispensable to GNSS satellite POD and commonly results in a factor of two improvement in orbit precision. Of particular importance is the narrow-lane ambiguity that results from combining the carrier-phase measurements from a pair of GNSS frequencies. One of the intermediate steps in the ambiguity resolution algorithm is the fixing of the double-differenced narrow-lane ambiguities to integer values. For reliable fixing, the fractional part of the difference between the integer and decimal (float) values should be as close as possible to zero and follow a symmetrical distribution. The “tailedness” of the distribution curve may be characterized by its kurtosis — the larger the kurtosis, the fewer values are in the tails of the distribution and the more peaked is the distribution. In other words, the larger the kurtosis, the closer the “fractionals” cluster around zero, the more ambiguities can be resolved with higher confidence, and the more accurate the resolved solution. Moreover, as satellite orbit and antenna phase center errors do not cancel out completely through double-differencing, the narrow-lane kurtosis may also be considered as an indicator for the accuracy of the satellite force and phase center models that were used. The results in Figure 9 show that the non-zero horizontal PCOs bring a major improvement and that the Fourier force model does give some additional benefit.
CONCLUSIONS
Adding a new GNSS satellite type to high-precision multi-GNSS solutions requires detailed knowledge and understanding of the satellite type. Key issues are the transmit antenna phase center parameters, the satellite’s attitude, and the radiation pressure forces acting on its surfaces.
In this article, improved antenna phase center, attitude, and radiation pressure models for the current series of GPS Block III spacecraft have been developed using multiple years of in-flight orbit and tracking data. A number of internal metrics such as post-fit carrier-phase residuals, day-boundary orbit differences (overlaps), empirical acceleration parameters, and carrier phase ambiguity statistics have been used to gauge the models’ performances. Overall, the results underscore the importance of the models for GPS III orbit determination. This applies primarily to the radiation force and the antenna phase center model, or more precisely, the horizontal (X and Y) offsets of the phase center model whose existence has been neglected for years in the analysis of GPS III data.
Comparison of the overlap statistics suggest that orbits generated based upon updated (non-zero) phase center corrections and ESA/ESOC’s new (Fourier-based) radiation pressure model in the background are better by almost a factor of two. The average overlap RMS errors calculated across all current Block III SVs and for each orbital component (radial, along track and across track) dropped from 21 , 28 and 35 millimeters down to 14, 21 and 16 millimeters, respectively.
More relevant when it comes to processing GPS data recorded on board low-flying satellites such as Sentinel-6 Michael Freilich or Jason-3, is the extension of the current IGS Block III antenna PCV model beyond a 14-degree boresight angle. After applying the extended PCV corrections, we reduced Block III carrier-phase residuals by 20% with no or few systematic signatures remaining, unlike the residuals produced with the current IGS antenna model. The IGS is strongly encouraged to adopt the Block III PCV extension into their antenna model to continue to support GPS-based POD of low-Earth-orbiting satellites.
For further details on ESA/ESOC’s solar radiation pressure modeling approach, see our paper “GPS III Radiation Force Modeling” presented at the IGS 2022 Virtual Workshop: click here.
FLORIAN DILSSNER is a satellite navigation engineer in the Navigation Support Office at the European Space Operations Centre (ESOC) of the European Space Agency (ESA), Darmstadt, Germany. He earned his Dipl.-Ing. and Dr.- Ing. degrees in geodesy from the University of Hannover, Germany.
TIM SPRINGER has been working for the Navigation Support Office at ESA/ESOC since 2004. He received his Ph.D. in physics from the Astronomical Institute of the University of Bern in 1999.
FRANCESCO GINI is a satellite navigation engineer in the Navigation Support Office at ESA/ESOC. He received his Ph.D. in astronautics and space sciences from the Centro di Ateneo di Studi e Attività Spaziali at the University of Padova in 2014.
ERIK SCHÖNEMANN is a satellite navigation engineer in the Navigation Support Office at ESA/ESOC. He earned his Dipl.-Ing. and Dr.- Ing. degrees in geodesy from the University of Darmstadt, Germany.
WERNER ENDERLE is head of the Navigation Support Office at ESA/ESOC. He holds a doctoral degree in aerospace engineering from the Technical University of Berlin, Germany.


