No audio available for this content.
My June 2026 GPS World newsletter discussed how the National Geodetic Survey (NGS) plans to address tectonic plate motion and intra-frame deformation. Most geospatial users now recognize that International Terrestrial Reference Frame (ITRF) coordinates include a velocity component driven by tectonic plate movement. To manage these continually changing coordinates, NGS intends to incorporate time-dependent modeling and has developed two key models—EPP2022 (Euler Pole Parameters) and IFDM2022(Intraframe Deformation Model) — to make time-dependent geodetic control practical and usable. This newsletter examines whether InSAR technology can be leveraged to enhance and refine an Intraframe Deformation Model.
Why does this matter?
The Earth is moving far more than most people realize. Because we rarely feel that motion except during an earthquake, it is easy to assume the ground beneath us is static. That assumption is incorrect.
As noted in the June 2026 newsletter, EPP2022 (Euler Pole Parameters) models the rigid rotation of tectonic plates. In essence, the EPP model removes the plate’s rotational component from the horizontal velocities of ITRF2020 coordinates, producing what is commonly called a “plate-fixed” terrestrial reference frame. I examined the Euler Pole Parameters process in detail in my February 2022 and July 2024 GPS World newsletters.
Now what about the NGS’s IFDM2022 (Intraframe Deformation Model)?
NGS’s IFDM2022 computes the internal deformation and residual drift occurring within a tectonic plate. A slide presented by Dr. Dru Smith of NGS at the April 2026 Federal Geodetic Control Subcommittee (FGCS) meeting shows the IFDM2022 v1.0.0 model, which was completed in December 2025. Notably, the deformation values in IFDM2022 v1.0.0 are very small and appear to have been accurately estimated over a roughly decade-long time span.
IFDM2022
(https://www.ngs.noaa.gov/web/science_edu/presentations_library/)

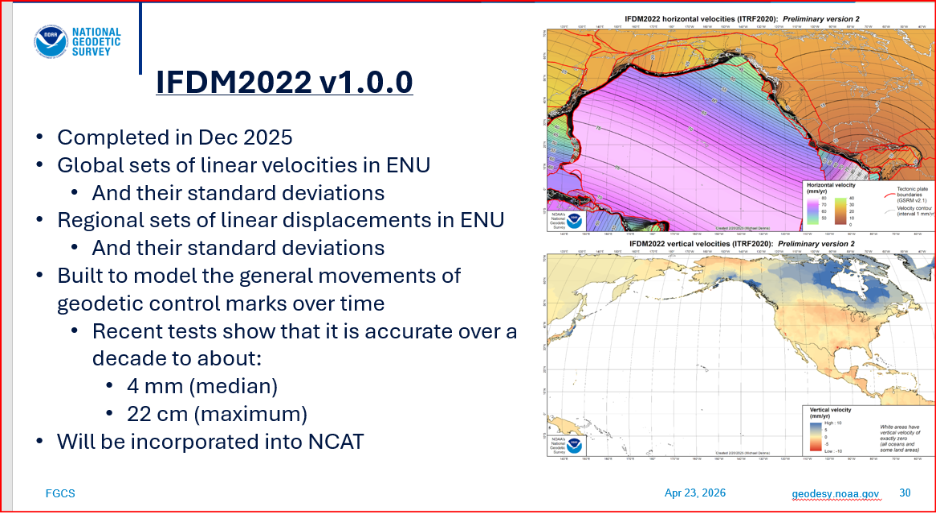
Image: NGS Website
(https://www.ngs.noaa.gov/web/science_edu/presentations_library/)
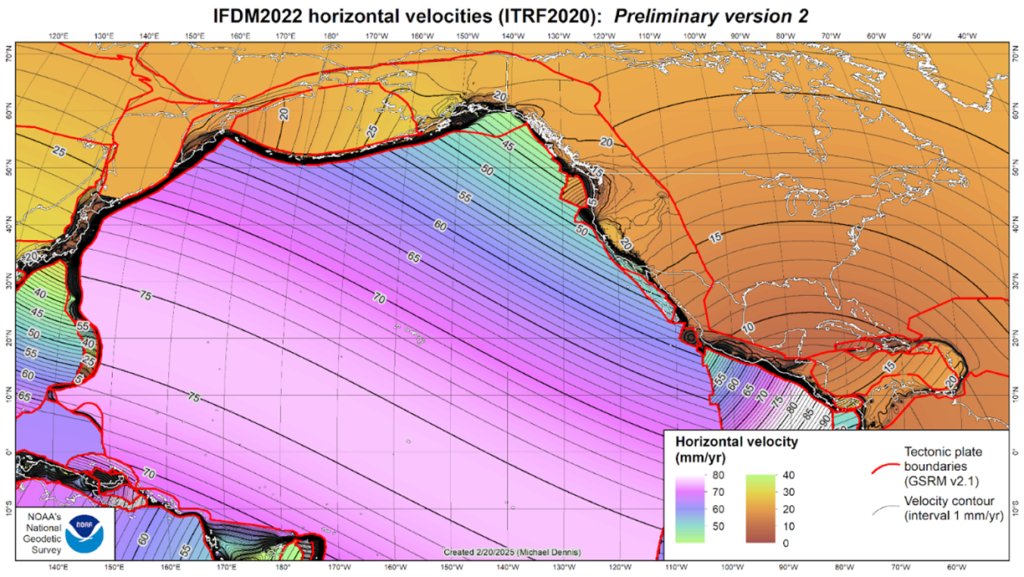
Image: NGS Website
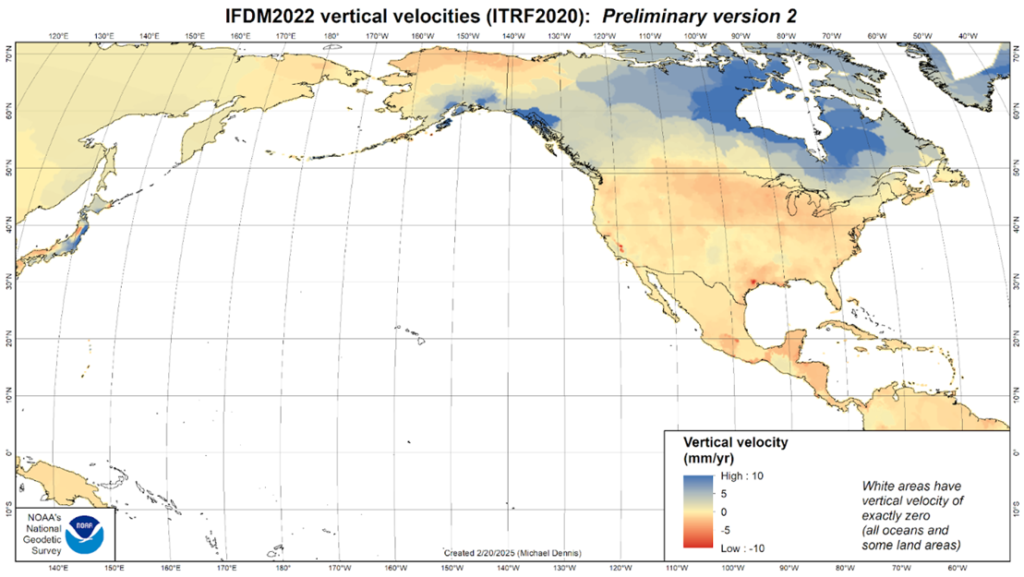
Image: NGS Website
It can be difficult to convince people of the importance of updating coordinates when they cannot feel the movement — except in earthquake-prone areas — and when the relative changes are so small over a decadal time scale.
This newsletter highlights an area of the United States experiencing significant changes in the vertical component of survey marks. Most users understand that the horizontal coordinates of marks change because of tectonic-plate motion and that NGS’s EPP model removes the rotational effects associated with that motion. However, the EPP model addresses only the horizontal component of movement.
What about the vertical component?
Each year, the Harris-Galveston Subsidence District (HGSD) compiles an Annual Groundwater Report for its Board of Directors. For a detailed overview of the agency’s identity and mission, please refer to the sidebar titled “Harris-Galveston Subsidence District (HGSD).”
Harris-Galveston Subsidence District (HGSD)

The HGSD Annual Groundwater Report provides the latest information on subsidence within the district, summarizing data from the previous calendar year. It includes:
- Climatic conditions: Context on precipitation, drought, and other factors that influence annual water demand.
- Water use: Pumpage data reported by permittees to characterize demand and usage.
- Water levels: USGS aquifer water-level measurements that show subsurface conditions.
- Measured subsidence: District monitoring-network results used to calculate current subsidence rates.
The report highlights subsidence trends over the past five years. Reports are available at: https://hgsubsidence.org/science-research/district-research/annual-groundwater-reports/
Using this data, HGSD produces interactive subsidence maps based on GNSS-derived rates computed from GNSS Continuously Operated Reference Stations (CORS) and HGSD Port-A-Measure Stations (PAMS). The methodology for calculating annual rates is documented in Houston GNSS Network for Subsidence and Faulting Monitoring: Data Analysis Methods and Products by Guoquan Wang, Ashley Greuter, Christina M. Petersen, and Michael J. Turco. See Exhibits 10 and 11 in the 2025 Annual Groundwater Report for station locations and estimated rates.
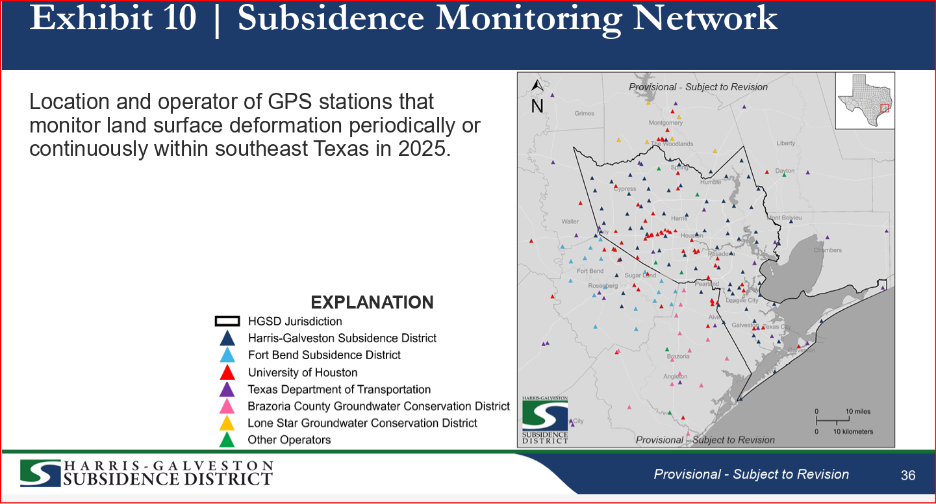
Image: HGSD Website
https://hgsubsidence.org/wp-content/uploads/2026/04/2025-HGSD-AGR-Public-Hearing-Presentation.pdf
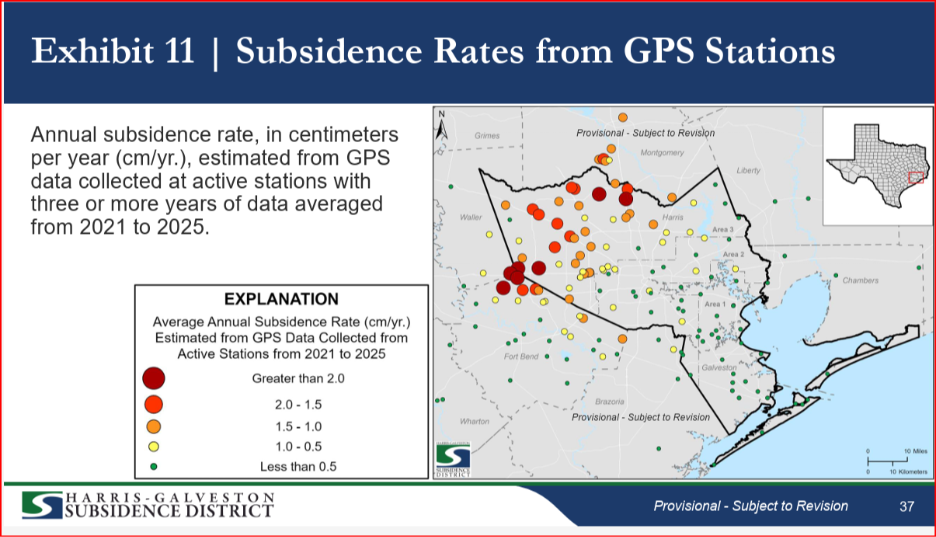
Image: HGSD Website
https://hgsubsidence.org/wp-content/uploads/2026/04/2025-HGSD-AGR-Public-Hearing-Presentation.pdf
Clicking on any station displays its specific details, including installation date, plots depicting changes over time, and local subsidence rate calculated from GNSS data. For instance, Station P047 — established in 2007 — shows a current subsidence rate of 1.84 cm/year.
Station Information for Station P047
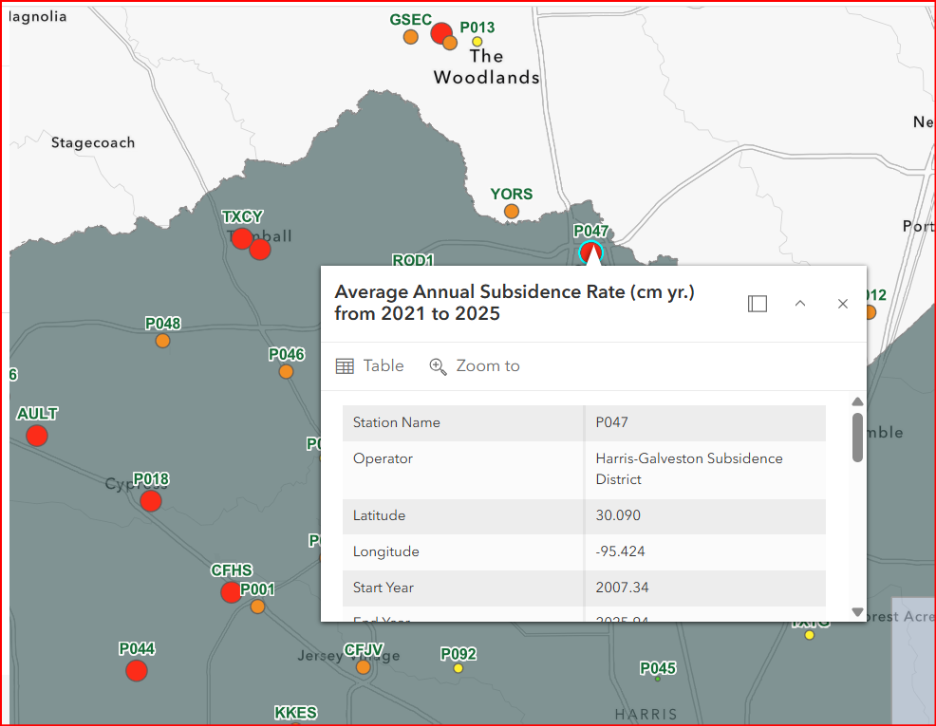
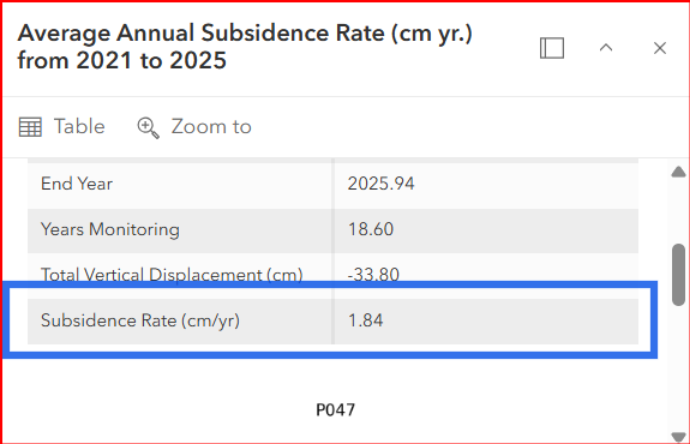
Image: HGSD Website
These localized GNSS stations deliver critical data on localized land subsidence, offering essential insights for water-resource management and helping surveyors assess coordinate stability for geodetic control marks. However, because each station only captures data at a specific, fixed point, mapping the areas between these marks requires interpolation. Relying solely on this network to understand regional subsidence is akin to painting with a very broad brush.
How can we economically capture precise subsidence data between fixed control stations?
To address this challenge, the Harris-Galveston Subsidence District (HGSD) launched a new interactive map that fills these geographic gaps. By integrating advanced scientific methods and satellite remote sensing, the program leverages Interferometric Synthetic Aperture Radar (InSAR). This technology compares satellite radar imagery captured over time to track land surface movements with significantly higher spatial resolution than traditional satellite methods. Explore the public data firsthand by visiting the HGSD Interactive Subsidence Map or read the official announcement on the Harris-Galveston Subsidence District News Portal.
HGSD Interactive Subsidence Map Using InSAR
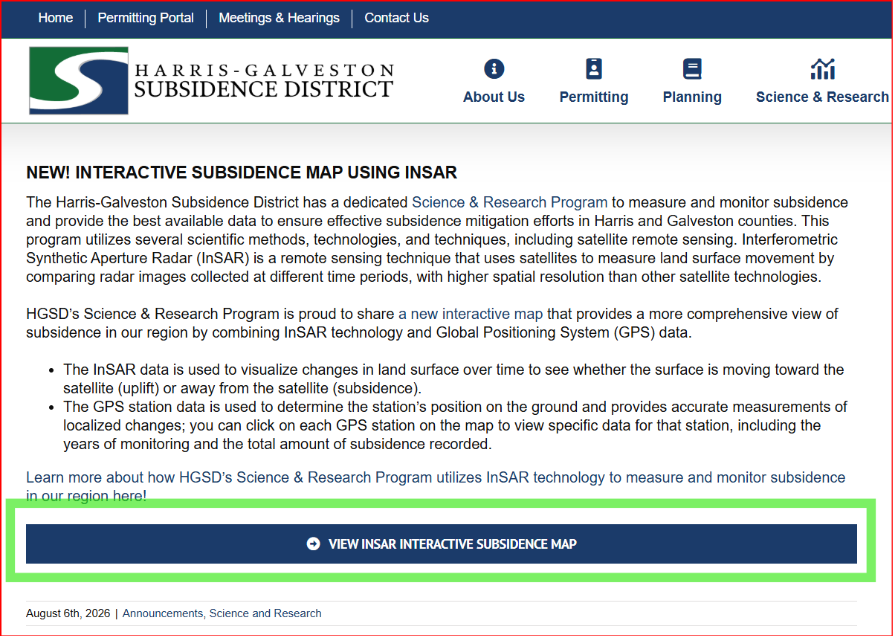
Image: HGSD Website
View of InSAR Interactive Subsidence Map
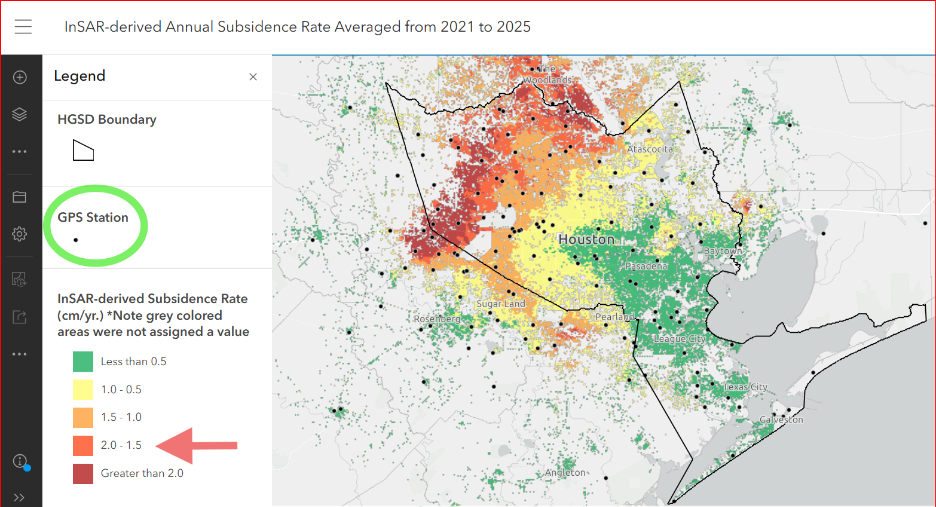
Image: HGSD Website
As shown in the map below, the surrounding region near Station P047 exhibits widespread land subsidence, with displacement rates consistently reaching 2 cm/year or greater across the area.
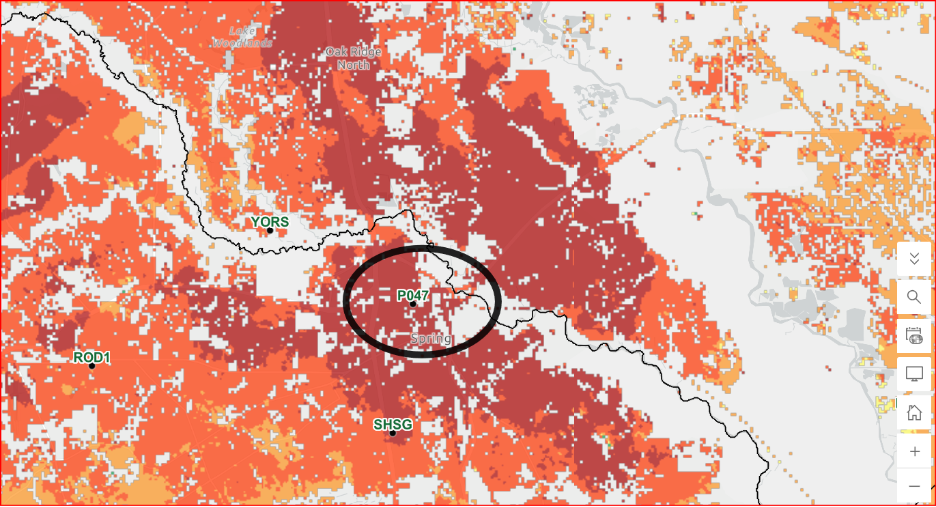
Image: HGSD Website
Again, why is this important?
Consider Station P047 as an example. With a subsidence rate of 1.84 cm/year, the land at this marker drops by 9.2 cm (0.3 feet) over a 5-year period.
According to Federal Emergency Management Agency (FEMA). Elevation Certificate and Instructions. Form FF-206-FY-22-152, Section C (Survey Information). All elevation measurements must be recorded to the nearest tenth of a foot (0.1 ft) to determine compliance with Base Flood Elevations. Because FEMA Elevation Certificates require structural heights to be accurate to the nearest tenth of a foot (0.1 feet), a benchmark that has shifted by 0.3 feet will no longer meet compliance standards. Relying on an outdated benchmark height can lead to significant errors in flood-risk assessments and insurance ratings.
While GNSS-derived data provides highly precise measurements for specific, localized points, InSAR technology delivers expansive spatial coverage across entire regions. By capturing data across wide areas, InSAR offers a far more cost-effective and accurate method for estimating subsidence rates between established control marks, allowing researchers to fully map and understand how different geographic locations shift in relation to one another.
Other regional agencies are developing intraframe deformation models to support the upcoming modernized National Spatial Reference System (NSRS). For example, to account for significant crustal motion, the California Spatial Reference Center (CSRC) developed a specialized method detailed in their August 2025 report, Project Report California Spatial Reference Network (CSRN) CSRN Epoch 2025.00 NAD83(2011) This updated framework incorporates local InSAR data wherever available to map surface displacement. For a deeper look at the CSRC’s efforts and the implementation of the new CSRN Epoch 2025.00 reference frame, refer to the September 2025 GPS World Article.
Excerpt from CSRC 2025 Report
7.4 SCIP
Transform ITRF2020 and NAD83(2011) coordinates at a specified date to an alternate date for any geographic location within the Western U.S. This is accomplished through interpolation of weekly displacement grids of GNSS displacement time series and an underlying geophysical model of constant geologic fault motions for the horizontal components. SCIP is a realization of the dynamic datum (Klein et al., 2019) developed for the California Spatial Reference Center (CSRC) with funding from Caltrans as a prototype for an intra-frame deformation model (IFDM) for the National Spatial Reference System (NSRS), funded by the National Geodetic Survey. http://sopac-adj.ucsd.edu/scip/
This newsletter underscores why developing an Intraframe Deformation Model is essential for updating and maintaining accurate coordinate values within a National Spatial Reference Frame. Additionally, it highlights how InSAR technology plays a vital role by providing detailed crustal movement data between discrete survey marks—ultimately demonstrating how satellite remote sensing can be leveraged to significantly enhance and refine these predictive deformation models.